Errors in The Effects of Nuclear Weapons: www.nukegate.org Glasstone's book ignores tactical nuclear weapons like the low yield cleaner air burst neutron bomb to credibly deter invasions, and ignores simple civil defense like smoke screens and improvised foxhole and earth shelters proved in nuclear tests, and uses unobstructed terrain data to exaggerate collateral damage from nuclear weapons thermal, nuclear radiation and blast effects! It is no longer a reliable or trustworthy reference book.
The curve, based on Brode's theoretical calculations with programs that include both hydrodynamic motion and radiation flow, can be represented by the simple equation:
P (psi) = (1.7 x 10¹⁰ /R3.4) + (7.0 x 10⁶ /R2) + (1,700 /R),
Dolan gives also a free air burst curve in Figure 2-2 on p. 2-7, which can be obtained by scaling the surface burst peak overpressure curve to a yield of about 0.565 kt, implying that surface bursts have an effective yield (due to reflection of blast wave energy into a hemispherical region) of 1.77 times the free air burst yield. Hence, the distance for any given pressure in a surface burst extends about 1.771/3 = 1.21 times as far as in a free air burst in sea level air. For a perfectly rigid surface, an effective yield increase factor of 2 would be expected since the same amount of blast energy for any radius would be concentrated in a hemisphere with only half the volume of the sphere for that distance. A reflection factor of 1.77 therefore implies that only 100(1 - 1.77/2) = 11.5% of the blast energy in a surface burst is permanently absorbed by the ground in the cratering, ground shock, and soil heating (fallout formation) processes. If the initial blast energy is 50% of the total yield in a free air burst, then in a surface burst it will be reduced to 44%. A discussion of blast theory and some test data is given in an earlier post linked here.
PRECURSOR EFFECTS
The history of the precursor is discussed in earlier blog post about Glasstone and Dolan. The billowing of thermally-raised smoke and dust in the blast wave of the TRINITY test (100 feet over dark desert soil) in 1945 should have been the suggested a modification of the blast by dust loading of the air in that region, but the first film of the precursor shock wave was obtained on the DOG shot of TUMBLER-SNAPPER in the Nevada in 1952. Dark coloured (brown) desert sand, consisting of crystals of silica, was exploded or 'popcorned' into hot dust by thermal radiation exposures of 11-19 cal/cm2 for yields of 35 kt to 1.4 Mt; a similar effect on lighter coloured (grey-white) coral sand required 15-27 cal/cm2. This formed a cloud of hot dust-laden air several metres high over the ground, which caused the blast wave to speed up and change in characteristics. The density of the dust added to the air increased the blast wind or dynamic pressure (which is directly proportional to the density), while the added momentum increased the duration of the blast winds, greatly increasing damage to structures and vehicles by the 'sandstorm effect' of the air-blasted dust cloud. The peak overpressure is somewhat reduced by the upward refraction of energy due to the temperature-height profile in the precursor region.
In 1953, the precursor effect was demonstrated by a comparison of damage from the ENCORE and GRABLE shots. The second test was at lower altitude so the thermal radiation was able to popcorn the desert effectively, creating far greater dynamic pressure effects than ENCORE at the same overpressures for drag effects on jeeps, trucks, and other dynamic-pressure sensitive targets. At subsequent tests in Nevada, selected areas around ground zero were flooded to form shallow lakes, while other areas were coated with asphalt, concrete, grass and other surfaces to investigate precursor development as a function of the reflective and physical nature of the surface. Precursors were noted at higher overpressures over coral sand, including surface bursts of over 30 kt yield (so that the fireball at thermal maximum is high enough to irradiate the ground with sufficient thermal energy to cause popcorning). Dolan's Capabilities of Nuclear Weapons, DNA-EM-1, 1972, p. 2-81, states that dust blast precursors will occur over dark city asphalt for burst altitudes below 800W1/3 feet, for W kilotons total yield, and for bursts over dark desert sand precursors will occur for burst altitudes below 650W1/3 feet. These formulae are valid for yields of 1-50 kt where observations are available (for other yields consideration must be given as to whether there is sufficient thermal exposure in the time before blast arrival for a dust layer to be produced).
Above: some typical qualitative precursor blast waveforms for overpressure and dynamic pressure, taken from Dolan's DNA-EM-1, 1972, which on pages 2-81 to 2-89 includes a detailed predictive system to indicate the shape of the precursor waveforms as a function of yield, height of burst and distance from ground zero. This was later developed into a quantitative precursor waveform prediction system in the late 1990s. At very high overpressures, the blast arrival is so soon after that detonation that very little of the thermal radiation has been emitted by the fireball, so there has been little development of a precursor in the available time. Therefore, the precursor develops gradually as the shock travels outward into areas which have been irradiated for longer times after burst, where enough thermal radiation has been emitted to cause a hot dust layer ahead of the shock wave. At long distances, the blast wave runs out of the dust layer because it encounters a region where the thermal radiation exposure has simply not been strong enough to 'popcorn' the sand or to 'smoke' the asphalt or grass. When this happens, the precursor encounters cooler air which makes it slow down, allowing the main blast wave (still travelling through air warmed by the precursor) to catch up and merge with the precursor, forming an ideal shaped blast wave once again.
(For a full discussion of these updates to EM-1, see the updated earlier post linked here.)
Above: Fig. 12 from John R. Keith and Anthony F. Portare, An Analysis of Army Thermal Transmissivity Calculations, Kaman Sciences Corp., Arlington, VA., report DNA-TR-84-388, AD-A176959 (1984). According to page 39 of the report, these are the air burst thermal yields radiated up to a time of 10 times the time of the final thermal maximum (10t2nd max.) as a function of weapon yield and burst altitude: “A general downward trend is noted with increasing yield.” This reduction of thermal yield fraction with increasing total weapon yield is the opposite of Harold L. Brode’s theoretical emission equation in his 1968 Annual Review of Nuclear Science article “Review of Nuclear Weapons Effects”. Brode’s incorrect conclusion (in simple radiative cooling models that ignore convective cooling and the engulfment of cold air) that the thermal yield fraction increases with increasing total yield, seemed to be justified by the simple fact that the concentration of nitrogen dioxide in the shock front that shields thermal emission from the hot fireball is dependent on overpressure.
This suggests that the distance of any given amount of nitrogen dioxide shielding should scale as the cube-root of the total yield, whereas the fireball radius at final thermal maximum scales as the two-fifths power of the total yield.
Consequently, as the total yield increases, a there should be a reduction in the shielding by the nitrogen dioxide, which as the total yield increases, extends to an ever smaller fraction of the fireball radius at second maximum. The fireball radius at second thermal maximum increases relative to the nitrogen dioxide shielding layer radius as the total yield increases, thus increasing the thermal yield fraction emitted up to that time as a function of total yield, because of the reduced shielding by nitrogen dioxide at higher yields.
However, this argument is only applicable during the period that nitrogen dioxide shock wave shielding of fireball core emission is important, i.e. only up to the final thermal maximum power, by which time about 20-30% of the thermal radiation is emitted. Since 70-80% of the thermal radiation is emitted after the time of the final thermal maximum power, the nitrogen dioxide shielding effect is not important in the late stages. Brode’s 1960s calculations of thermal radiation emission from the fireball omitted the effect of fireball cooling by engulfing cold air (in an air burst) and soil (in a surface burst) from the environment. Due to the inertia of air, these convection cooling effects take time to come into play and so are relatively more important in the case of megaton yields (which emit significant thermal radiation over a long period of many seconds) than kiloton yields, where most of the thermal radiation is radiated within a second, before efficient convection cooling starts. Hence, for higher yield nuclear weapons, convection cooling by the entrainment of cold air and (in the case of a surface burst) soil, quickly cools the fireball after the time of thermal maximum and reduces the fraction of the total yield emitted as thermal radiation in an air burst. The 10t2nd max. thermal yield fraction for a sea-level air density free air burst falls from 35.0% at 1 kt to 34.1% at 10 kt, 33.0% at 100 kt, 29.1% at 1 Mt and to 25.4% at 10 Mt (source: DNA-TR-84-388, AD-A176959, 1984, Table 6, page 42).
In a surface burst, the thermal yield trend as a function of total yield is the opposite to that in a free air burst, because the crater ejecta throw-out shields thermal radiation emission from the fireball more effectively at low yields than at high yields. The radius for any given degree of thermal radiation shielding by crater ejecta scales as the cube-root of yield at sub-kiloton total yields and typically as the quarter-power of total yield for the megaton yield range; thus it is always scaling as a weaker function of total yield than the fireball radius at final thermal maximum, which scales as the two-fifths power of yield. Hence, more of the fireball thermal radiation gets shielded by crater ejecta throw-out in low yield surface bursts than in high yield surface bursts. This makes the thermal yield fraction in a surface burst increase from 4.5% at 1 kt to 6.6% at 10 kt, 13% at 100 kt, 16% at 1 Mt, and 17% at 10 Mt (source: DNA-TR-84-388, AD-A176959, 1984, Table 6, page 42).
Above: Fig. 13 from John R. Keith and Anthony F. Portare, An Analysis of Army Thermal Transmissivity Calculations, Kaman Sciences Corp., Arlington, VA., report DNA-TR-84-388, AD-A176959 (1984). According to page 39 of the report, these are the air burst thermal yields radiated up to a time of 10 times the time of the final thermal maximum (10t2nd max.) as a function of weapon yield and burst altitude: “A general downward trend is noted with increasing yield.”
Above: Table 6 from John R. Keith and Anthony F. Portare, An Analysis of Army Thermal Transmissivity Calculations, Kaman Sciences Corp., Arlington, VA., report DNA-TR-84-388, AD-A176959 (1984). According to page 39 of the report, these are the thermal yields radiated up to a time of 10 times the time of the final thermal maximum (10t2nd max.). Notice that, as we have explained physically, the sea-level air burst thermal yield fraction decreases with increasing total yield because more and more of the cooling is done by convection mixing processes rather than by radiation in the longer thermal pulse of higher yields, while in a surface burst the thermal yield fraction increases with increasing total yield, because the crater ejecta throw-out radii which absorb much thermal radiation in a surface burst scale less rapidly (i.e., as the cube or fourth root) with total yield than does the fireball radius at final thermal peak power (i.e., the two-fifths power of yield).
Above: Fig. 14 from John R. Keith and Anthony F. Portare, An Analysis of Army Thermal Transmissivity Calculations, Kaman Sciences Corp., Arlington, VA., report DNA-TR-84-388, AD-A176959 (1984). This diagram shows the effect of burst altitude from sea level to 30 km upon the thermal pulse curve shape for a 100 kt air burst. The report notes that a surface burst thermal power curve is not identical to a sea level air burst, but on account of the extra opacity of the fireball due to the earth incorporated from the crater process, the surface burst thermal curve has a much smaller final thermal maximum radiating power. The surface burst fireball also takes a slightly longer time to reach the final peak thermal emission, than an equivalent yield sea level air density air burst.
Above: Fig. 15 from John R. Keith and Anthony F. Portare, An Analysis of Army Thermal Transmissivity Calculations, Kaman Sciences Corp., Arlington, VA., report DNA-TR-84-388, AD-A176959 (1984). This diagram is a linear version of the logarithmic plots in Fig. 14, showing how the shape of the standard thermal pulse curve depends on burst altitude for air bursts of 100 kt total yield.
Above: Fig. 21 from John R. Keith and Anthony F. Portare, An Analysis of Army Thermal Transmissivity Calculations, Kaman Sciences Corp., Arlington, VA., report DNA-TR-84-388, AD-A176959 (1984). This diagram shows how the different wavelengths in the thermal radiation spectrum, from 0.32 micron ultraviolet to 1.87 micron infrared, are transmitted through a standard Nevada desert atmosphere for an air burst 1 km above ground (or a megaton range surface burst fireball with a radius of over 2 km, so that the mean height of the radiating surface is 1 km above ground) with ground level taken to 1.28 km above sea level. The data come from Kaman Science Corporation’s TRAX Monte Carlo simulation code for atmospheric transmission. Notice that the 0.32 micron curve for ultraviolet shows rapid attenuation due to absorption by natural ozone in the atmosphere, and the 1.87 micron infrared curve shows absorption by water vapour and carbon dioxide; but the shape of the transmission curves for ultraviolet and infrared are totally different (each departs from a straight line exponential attenuation law by curving in a different direction from a straight line, so that the average would be close to a straight line and thus a simple exponential attenuation law). Because the transmission fraction is a logarithmic plot while distance is linear plot, a straight-line transmission on this graph represents exponential attenuation and a curve represents a departure from exponential attenuation. The data for the wavelengths between the extremes, i.e. 0.55, 0.94, and 1.23 microns, all show much less attenuation as they are closer to (or within) the visible radiation band. The 0.55-micron curve shows a transmission of 70% to a horizontal range of 30 km. If this is treated as an exponential absorption with the typical Nevada desert visibility range of 80 km, then the Nevada nuclear test data thermal radiation transmission, T = e-R/V = e-30/80 = 0.69, is similar to the 0.55-micron wavelength transmission predictions. However, this simplified approach (used in the 1960s by Gibbons) would not be justified because it would properly take account of the effect of atmospheric water vapour of air near sea level on the infrared radiation transmission.
Above: Fig. 39 from John R. Keith and Anthony F. Portare, An Analysis of Army Thermal Transmissivity Calculations, Kaman Sciences Corp., Arlington, VA., report DNA-TR-84-388, AD-A176959 (1984). Transmission for a surface burst and a 1 km altitude air burst (or a high yield surface burst where the mean height of the hemispherical fireball radiating surface is 1 km high) for sandy soil ground, 300 m base altitude cloud cover, and 25 km atmospheric visibility (1.5 g/m3 of sea level water vapour concentration). This report proves that the effect of the fireball radiating temperature on changing the source spectra of the thermal radiation as a function of weapon yield and for ground interaction is negligible in comparison to the effect of the height of the fireball. The thermal transmission as a function of distance is similar for different yields if the effective fireball height above the ground is the same. It is also similar for a surface burst and a sea level air burst (although obviously the thermal yield will be different in each case) if the mean height of the fireball is the same. However, varying the height of the centre of the radiating surface of the fireball causes a large change in the thermal transmission curve, mainly as a result of the variation in the water vapour content of the air as a function of height. The cooler air at higher altitudes contains less water vapour and therefore allows more transmission of infrared radiation than sea level air.
Above: Fig. 40 from John R. Keith and Anthony F. Portare, An Analysis of Army Thermal Transmissivity Calculations, Kaman Sciences Corp., Arlington, VA., report DNA-TR-84-388, AD-A176959 (1984). Thermal transmission from a 100 kt surface burst with the fireball at ground level for a hypothetical dark, zero albedo ground, i.e. a totally radiation absorbing, non-reflective ground which does not reflect any of the thermal radiation, for no cloud cover (curve 1) and cloud cover with its base at altitudes of 300 m (curve 2), 1,500 m (curve 3) and 3,000 m (curve 4), with in each case 25 km atmospheric visibility (1.5 g/m3 of sea level water vapour concentration). Curve 1 therefore presents the case where the transmission is purely a function of the air characteristics, without any ground or cloud reflection effects.
Above: Fig. 41 from John R. Keith and Anthony F. Portare, An Analysis of Army Thermal Transmissivity Calculations, Kaman Sciences Corp., Arlington, VA., report DNA-TR-84-388, AD-A176959 (1984). Thermal transmission from a 100 kt surface burst with the fireball at ground level for a sandy soil, for no cloud cover (curve 1) and cloud cover with its base at altitudes of 300 m (curve 2), 1,500 m (curve 3) and 3,000 m (curve 4), with in each case 25 km atmospheric visibility (1.5 g/m3 of sea level water vapour concentration). Curve 1 therefore presents the case where the transmission is purely a function of the air characteristics and ground reflection, with no cloud reflection effects. We have added curve 5 (which is curve 1 from Fig. 40 already given, for a non-reflecting ground and no cloud cover) to show the small effect of the ground reflection on transmission. It is clear that when both ground reflection and cloud reflection occur, the surfaces act like a waveguide for thermal radiation energy, whose transmission is enhanced by “channelling” of thermal energy.
Above: Fig. 43 from John R. Keith and Anthony F. Portare, An Analysis of Army Thermal Transmissivity Calculations, Kaman Sciences Corp., Arlington, VA., report DNA-TR-84-388, AD-A176959 (1984). Thermal transmission for a sandy soil, for no cloud cover (curve 1) and cloud cover with its base at altitudes of 1,500 m (curves 2), 1,500 m (curves 3) and 3,000 m (curves 3), with in each case 25 km atmospheric visibility (1.5 g/m3 of sea level water vapour concentration). High level clouds above the nuclear explosion can enhance thermal transmission, by reflecting back to the ground some of the thermal radiation that would otherwise be lost to space. But when a nuclear explosion occurs in or above a cloud layer, or above a smoke screen, the opposite effect occurs and the thermal radiation is shielded and attenuated to a considerable extent prior to reaching a target. During Pacific nuclear tests of air and high altitude bursts in 1958 and 1962, cloud cover over ground zero was either required as a condition for firing, or alternatively was provided artificially by smoke screen generators in order to prevent any risk of injury to the dark coloured terns. Similarly, for the very high altitude tests in 1962 where the fireballs would be above the horizon as viewed from the Hawaiian islands 1,300 km always, firing was only authorized when there was low-level local cloud cover over the Hawaiian islands to protect the public from any risk of retinal injury. Nevada tests in 1955 over smoke screens demonstrated the value of smoke clouds in attenuating thermal radiation from nuclear weapons. The 110 kt 1954 CASTLE-KOON test at Bikini Atoll was detonated in a rainstorm with very low visibility, and thermal radiation effects were undetectable at the measuring stations.
Above: Fig. 44 from John R. Keith and Anthony F. Portare, An Analysis of Army Thermal Transmissivity Calculations, Kaman Sciences Corp., Arlington, VA., report DNA-TR-84-388, AD-A176959 (1984). Thermal transmission in 6.5 km atmospheric visibility (10 g/m3 of sea level water vapour concentration) for a 10 kt surface burst with 300 m base cloud cover and three different ground surface reflections: zero reflection, dirt (sandy soil), and snow. Comparisons of these curves to those of the previous figure prove that the ground reflection characteristics are much less important in determining thermal radiation transmission than the atmospheric visibility, the fireball altitude, and the cloud cover situation. The curve for dirt (sandy soil) with 6.5 km visibility due to 10 g/m3 of sea level water vapour concentration in the air and cloud cover with its base at 300 m represents the mean transmission to be expected for thermal radiation in the U.K. and other areas of Northwest Europe, as shown by statistical data in DNA-TR-84-388, AD-A176959 (1984).
Above:Ernest Bauer's August 1990 Institute for Defense Analyses report, Physics of High-Temperature Air. Part. 2. Applications, ADA229778, contains a useful section summarising a little of the available nuclear testing data on the mass of fallout as a function of burst altitude for surface bursts, free air bursts, and tower burst nuclear weapons tests, as well as the family of computed curves above showing the transition from a single thermal pulse for a 1 Mt air burst at 50 km altitude to a double-pulse for a 1 Mt sea level air burst. The main reason for the transition is the weakening of the shock wave due to the lower air density at higher altitudes: the lower air density at high altitudes simply allows the X-rays (which comprise 75% of the primary energy emission from a typical 1 ton mass, 1 megaton yield detonation) to travel much larger distances before being absorbed by the air.
This means that same amount of energy is spread over a larger volume of air in a high altitude burst, so the energy density (energy per unit volume) in the fireball is lower than it is for the tiny initial X-ray fireball at sea level, and this lower energy density produces a smaller temperature rise, and thus a weaker blast wave. This weaker blast wave at high altitudes is unable to compress air to a high enough density to form the concentrations of nitrogen dioxide that shield thermal radiation after shock formation in a sea level detonation. The nitrogen dioxide formed in the shock wave from compressed hot air absorbs the thermal radiation from the fireball core in a sea level detonation, causing the minimum and thus the two pulses, but nitrogen dioxide is not formed in a high altitude burst because the shock wave is not strong enough to produce it, hence the thermal minimum gradually disappears as the burst height is increased, merging the two pulses together into a single pulse for a 1 Mt detonation at 50 km altitude.
'This compendium presents a reasonably thorough summary of the physics and chemistry that is particularly relevant to the prediction of effects of high-altitude nuclear bursts on radar, optical, infrared, and communication systems. The various chapters have been written by experts on the particular subjects. Most of the presentations are on a fairly advanced level, but a serious attempt has been made to keep in mind the special needs of new workers in this field. It is assumed that the reader has a thorough general background in physics.'
A 57 MB March 2008 report by V. A. Logachev and L. A. Mikhalikhina, Animal Effects from Soviet Atmospheric Nuclear Tests, ITT Corp., Alexandria, VA., report ADA485845, is available online in PDF download format. There is another version available in more compressed PDF format here. The Soviet Union exposed 8,000 animals (sheep, horses, cattle, camels, etc.) in various structures, vehicles, and in the open and shadowed positions, to nuclear explosions in order to assess the effects in different situations, and to different combinations of the various effects of nuclear detonations. Instead of simply giving the straightforward data on effects from specific nuclear tests, the data is presented only as processed output having been combined into three categories of yield range. However, it is still an important report. Table 11 on page 27 gives the following burns energies comparison for bare skin, light summer clothing and heavy winter clothing (as with most Russian nuclear weapons research, they seem to make every effort to cause confusion and ambiguity in the simplest presentations; here it is not stated for which yields the data for burns under clothing apply to):
ABOVE: The 1956 Australian-British Maralinga cratering nuclear surface burst, Buffalo-2, prepared for firing at Marcoo site. The middle of the weapon is carefully aligned to the height of the ground surface. Notice however that the weapon, despite having a low yield of just 1.4 kt, is a massive implosion device with a diameter of 5 feet. The heavy weight of the implosion system and carrying cradle added mass for the "case shock" of the weapon increasing the energy carried by that dense case shock, as opposed to the percentage of energy released from the weapon as the X-ray emission; the altered partition of energy between bomb case kinetic energy and X-ray fireball energy dramatically increase the cratering and ground shock effects. (The Buffalo-2 crater and extensive ground shock measurements are available in PDF as the UK Atomic Weapons Establishment report "AWRE T37 57", which is located at https://archive.org/details/DnaEm1CapabilitiesOfNuclearWeapons, linked here.)
X-rays dispersed outside of the bomb have only a trivial effect on the ground, ablating a thin surface layer of the ground and heating up the air, contributing mostly to air blast, not direct ground shock or cratering (it does produce the "air slap" ground shock, but this is rapidly dissipated with depth into the ground). The downward portion of the dense case shock, on the other hand, embeds itself deeply into the ground, and is the major source of cratering and direct ground shock, coupling about half of the case shock kinetic energy into the surface and producing essentially all of the cratering and close-in ground shock energy.
Air-slap from the blast produces on a trivial effect on the crater and ground shock because of its relatively low density (the transfer of energy from an air shock wave into the ground is trivial because of the mismatch of acoustic impedance in the two media, due to the fact that the ground is much denser than the air shock wave even at the greatest overpressures near ground zero). Heavy weapons with a relatively small yield to mass ratio are thus far more effective at cratering than modern lightweight designs. (This bomb design effect on cratering was proved by H. L. Brode and R. L. Bjork in their 1960 RAND Corporation report RM-2600, Cratering from a Megaton Surface Burst, but was never even mentioned in Glasstone's Effects of Nuclear Weapons.)
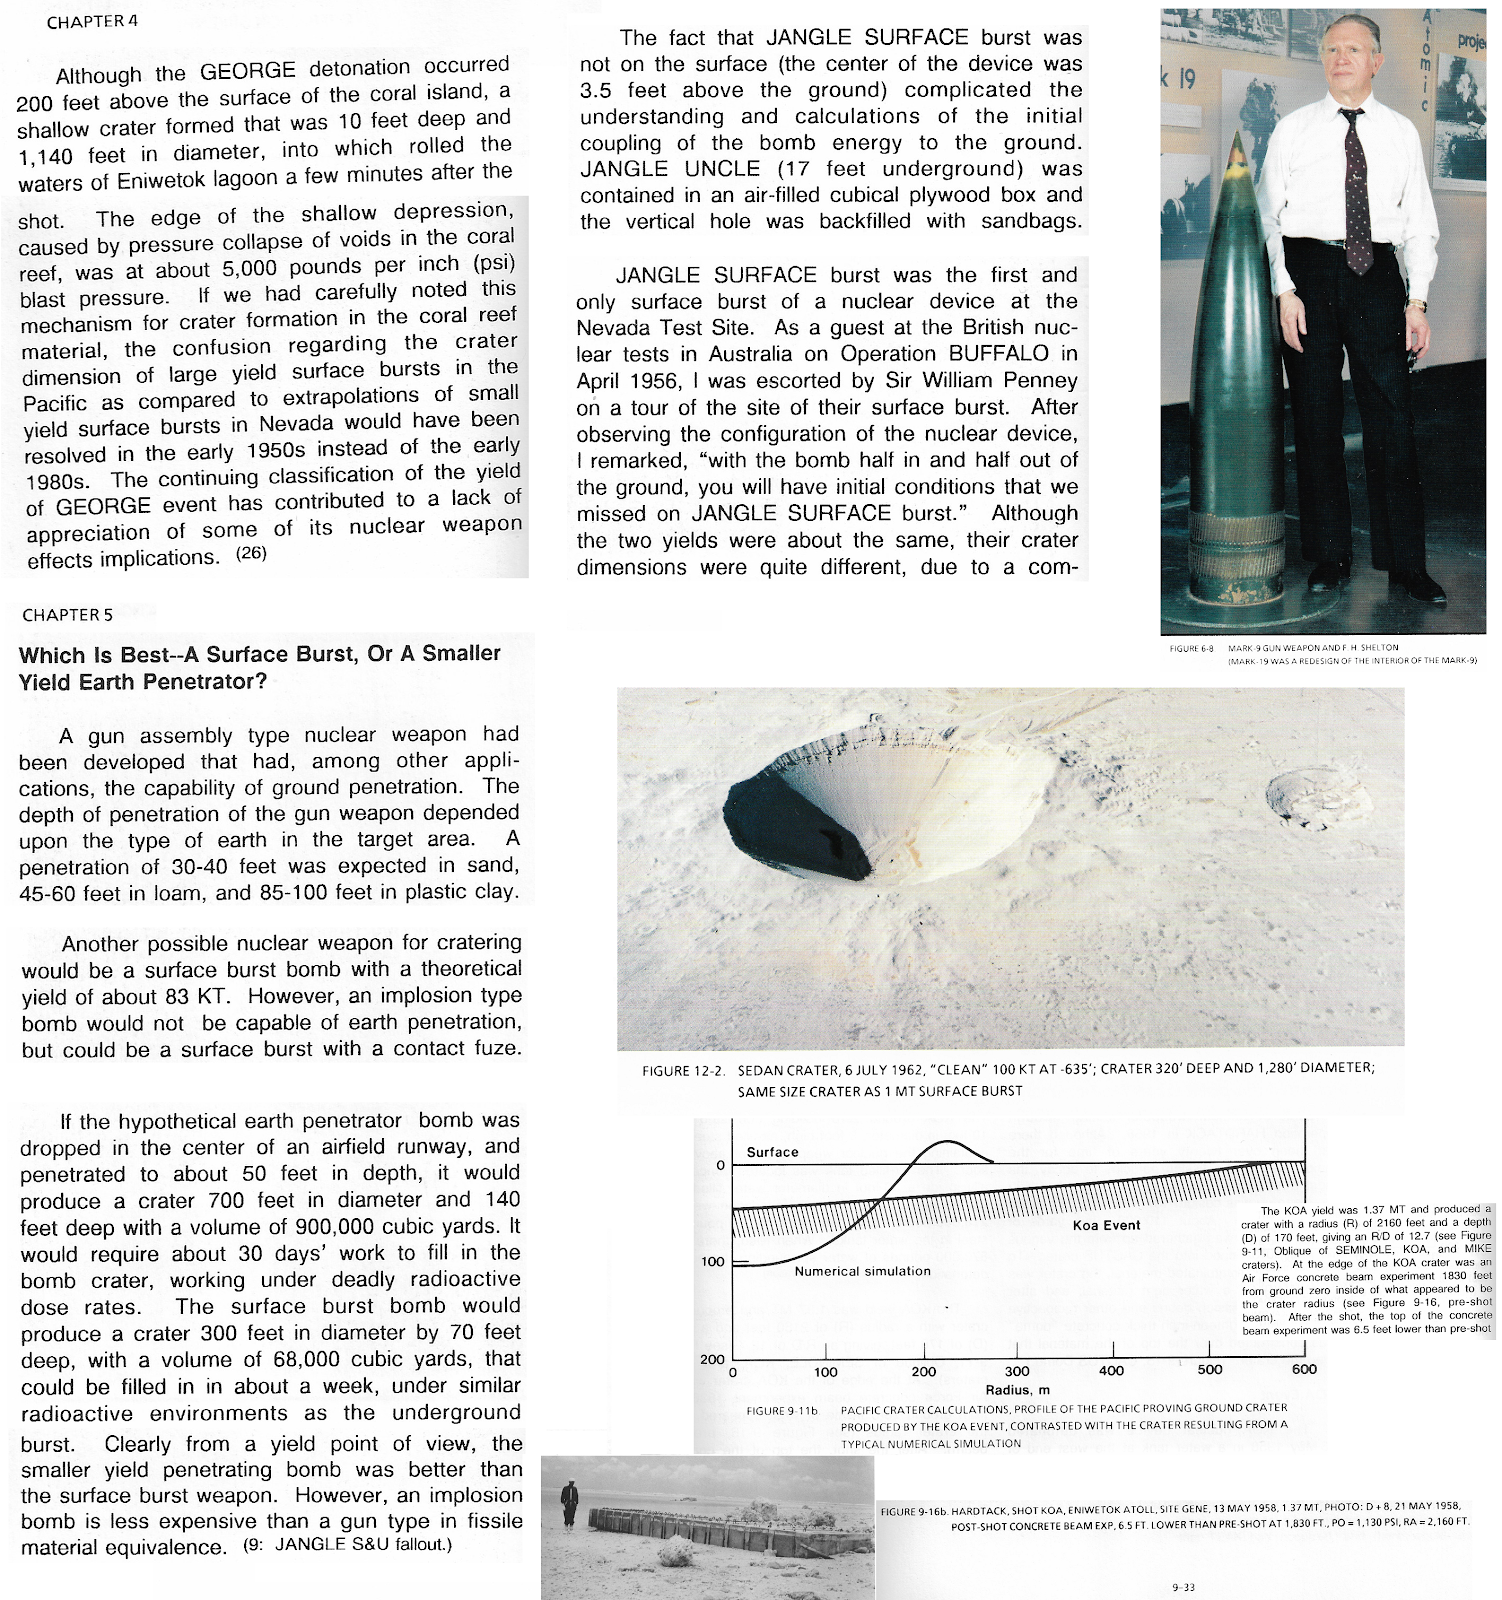
Above: excerpt from Dr Frank H. Shelton's revised (2nd printing, 1990) book Reflections of a nuclear weaponeer, dealing with cratering (earlier in the book he gives an account of his Wednesday 25 March 1987 slide show on "Thermonuclear weapon tests and Pacific craters", debunking Glasstone and Dolan's Effects of Nuclear Weapons analysis at Lawrence Livermore National Laboratory, and the next day, at 10am in Edward Teller's office at that lab, he explained how American nuclear test cratering analysis was fatally flawed, receiving in return Teller's usual complete incomprehension, disinterest and lack of support for nuclear weapons effects improvements. Shelton had visited a concrete beam experiment at Eniwetok Atoll (color photos above from page 9-33 of Shelton's book): after the 1.37 megaton Koa surface burst, they were sticking up above the ground surface. This proved that the Pacific coral craters are not the ejecta cratering that occurs in dry soil, but merely compression of coral by high pressure. Teller didn't want to know. This problem continues in the whole DTRA approach to the revision of cratering, e.g. failing to publish an unclassified correction/update for the 1977 Glasstone and Dolan Effects of Nuclear Weapons, and bungling the cratering chapter 3 of the 1992 revised EM-1 as abstracted in John A. Northrop's 1996 limited-distribution Handbook of Nuclear Weapon Effects: Calculational Tools Abstracted from EM-1. The latter masters the art of being as clear as mud, by obfuscating the crater dimensions corrections, by breaking the crater scaling laws into two parts: section 3.1.1.2 on page 79 and table 3.3 on page 84 assume that the initial x-ray yield fraction varies from <20% at <1 kt to >80% at >20 kt, and gives scaling laws based on these assumptions for various soil types, which appear to contradict what Northrop writes on page 80, section 3.1.1.4 where he writes that for "small yield" weapons the crater volumes are directly proportional to yield (so for conventional bombs and sub-kiloton nuclear weapons, the crater diameter and depth scale as the cube-root of yield), whereas for "higher yields, where gravity effects become important", crater sizes scale less than proportionally with yield! (But after that very brief useful mention, Northrop says nothing further of the effect of gravity on the huge recent crater scaling law revisions!)
However, Northrop on page 86, section 3.1.3, suddenly discloses how EM-1 incorporates gravity effects at high yields (without mentioning "gravity" at that point): he states that the crater scaling laws in the earlier sections of the chapter are non-observable (pretty much imaginary) "dynamic crater size", and the observable or "apparent" crater is smaller due to a large proportion of the ejected material falling or slumping back into the crater, to partially re-fill it, which reduces the apparent crater size (the fallback effect)! Therefore, we find that the crater scaling laws he gave in table 3.3 are fictitious and need to be modified by a further equation (equation 3.16), which has a yield dependence that effectively changes the crater sizes scaling laws.
Northrop's equation 3.16 states that the apparent crater volume, Vapparent = Vdynamic(1 - ffallback), where ffallback is defined in equation 3.17 as ffallback = 0.27 for all yields and soils apart from dry soil. This constant value appears in serious error, contradicting other crater revisions data that we will discuss later in this blog post. However, for dry soil and for high x-ray output weapons (yields of 20kt and above, with x-ray yields of 80% or greater), equation 3.18 yields: ffallback = 0.470 - 0.313W-0.145, where weapon W is yield in kilotons. This implies that ffallback = 0.157 for 1kt, 0.355 for 1 Mt and 0.388 for 10 Mt. Thus, putting equation 3.18 into equation 3.17, we get Vapparent = Vdynamic(0.530 + 0.313W-0.145) = 0.843 for 1 kt, 0.645 for 1 Mt and 0.612 for 10 Mt. These values do not give the correct crater scaling as compared to detailed results in articles and books on the revision to cratering, given later in this blog post. Northrop gives no graphs to evaluate or compare these formulae with nuclear test data, or with detailed computer cratering simulations. Consequently, Northrop's book is of no use in helping to understand or predict crater size revisions due to gravity effects.
Northrop in several places admits to confronting classification difficulties with secrecy on nuclear weapons effects, e.g. he only summarises 1993 EM-1 chapters 2-11, 14-16, 18 and 21-22, stating in his preface (p. iii) that the other 6 chapters of EM-1 are omitted from the handbook partly, "as a result of their extensive classified database". The thermal radiation and initial nuclear radiation data omit shielding due to city skylines are so are entirely misleading unless bombs are dropped on unobstructed deserts. This classification problem also affects his data summaries. E.g., Chapter 10, Electromagnetic Pulse Effects, omits the actual high altitude EM-1 EMP data (except for surface burst, where a detailed model for radiated surface burst EMP waveforms is provided), due to its secrecy classification and instead gives a simplified EMP model from report DNA-TR-84-47 (dated 1984) in figures 10.4 and 10.5, showing that a 400 km altitude burst produces a maximu peak EMP of 4, 20 and 40 kV/m for weapon prompt gamma ray yields of 0.1, 1 and 10 kt, respectively, while the fraction of this maximum which extends to the earth's horizon or tangent point ranges from 0.1-0.5 as prompt gamma ray yield is increased from 0.1-10 kt. While Northrop's book does contain many useful nuggets of data from the 1993 EM-1,including useful tables of neutron and gamma ray outputs from neutron bombs in tables 8.5 and 8.6 on page 337, and many useful graphs and tables of x-ray ablation effects for ABM or thermonuclear warhead design, it has many limitations on consistency. (Northrop's 1996 book is the result of thousands of pages of "sanitized" i.e. partly declassified EM-1 chapters, with deletions of data that can not be declassified, produced during the mid-1990s, as a result of a Freedom of Information Act request by a third-party, allegedly interested in arms control, which has failed to publish the information in full.)
Bruce G. Blair in his 1993 Brookings Institution book, The Logic of Accidental Nuclear War, pages 133-140 analyses the massive exaggerations by Glasstone and Dolan on crater/ground shock effects to buried shelters:
"... the most heavily fortified allegedly could withstand blast overpressures as high as several thousand pounds per square inch. ... a very deep command centre beneath the Kremlin ... in the early 1980s earned a Lenin Prize for former general secretary Chernenko. The largest underground complex ... was situated at Ramenki at an estimated depth of 650-1,000 feet. It could accommodate 10,000 people. ... Recently the U.S. Department of Defense reviewed the pertinent historical evidence gathered during nuclear tests and developed new models of the vulnerability of underground structures to nuclear explosions. These calculations differed substantially from those derived from earlier models. ... the dimensions of a crater produced by a nuclear explosion were estimated to be considerably smaller than previously thought. ... the radius of a crater produced by a 1 Mt nuclear explosion on the surface of wet soil [crater radii will be only 58.3% this size in Moscow's wet soft rock, which is tougher to crater than wet soil] would be 651 feet according to the old formula, whereas the new formula estimated the radius to be 394 feet. ... A 9 Mt bomb would have produced a crater radius of 590 feet in wet soil [according to the new formula] ... Under the new formula the pertinent calculations for this location's [the shelter at Kuybishev where Stalin retreated in WWII] geological composition (dry soft rock, according to U.S. analysts) indicate a crater radius of only 180 feet for a 1 Mt weapon, or 262 feet for a 9 Mt weapon. ... on the old formula ... crater radius would have been 485 and 937 feet for 1 Mt and 9 Mt..."
'Capabilities of Nuclear Weapons, DNA EM-1 (Reference C-2), is the best single comprehensive reference on all aspects of nuclear weapon phenomena and effects. This classified two-volume set both complements and supplements The Effects of Nuclear Weapons. Volume 1 focuses on nuclear weapon phenomenology and Volume 2 covers nuclear weapon effects that are primarily of military interest. This major DNA handbook, often referred to by its report number "EM-1," was last published in 1972 (with minor revisions through 1981), but it is presently being completely revised. When updated, EM-1 will again serve its important role as a basic source document for the preparation of nuclear operational and employment manuals by the military services.'
DNA [Defense Nuclear Agency, which has since evolved into the DTRA] has recently completed an "end-to-end" cratering validation program that resulted in dramatic reduction of the crater size thought to result from the surface detonation of modem strategic weapons. Although a major field exploration and several underground nuclear tests conducted in this program occupied the spotlight, numerical simulations were in many ways more central to DNA's success. This article recounts the integrated role of the numerical simulations, re-interpretation of existing nuclear data, and additional field events in the evolution of DNA's view on nuclear cratering.
DNA developed a crater specification methodology for its 1972 Capabilities of Nuclear Weapons - Effects Manual Number 1 (EM-1) with the acknowledgment that the nuclear database was incomplete and probably inappropriate for application to strategic yield surface burst weapons. The cratering events conducted at the Nevada Test Site (NTS) employed low yield sources suspected to produce larger craters than modern weapons of strategic interest. Data from the several high yield cratering events conducted at the Pacific Proving Grounds (PPG) were considered flawed by the atoll reef geology that was highly dissimilar to sites of interest. The 1972 EM-1 methodology was an attempt to reconcile these shortcomings.
The strategic source surface burst crater specifications were based on high yield PPG data, calibrated to sites of interest by comparison of low yield nuclear and high explosive craters in various geologies. Figure A.1 depicts 1 Megaton crater profiles for two geology types as specified in 1972 EM-1. ...
The numerical simulations indicated that strategic yield sources would produce craters one-third to one-fifth the scaled size produced in these events due to the relative inefficiency of the x-ray coupling process relative to hydrodynamic coupling. ...
Today, DNA relies on numerical cratering and ground shock simulations as key integral parts of its experimental program. They are the basis for cratering specifications for near-surface bursts in EM-1, 1991. Figure A.5 compares 1991 EM-I craters on two geology types to the profiles perceived in 1972. This dramatic shift in perception is based on the compelling evidence obtained in the highly successful field program discussed in this article. The current DNA reliance on numerical simulations is a result of the recognition that they provided the motivation for this program, enabled the success of the field activities, and today provide the means to apply this test experience to specific strategic weapon and geology combinations of interest. ...
For high yield surface bursts, however, there is another vitally important use of energy in order to excavate a big crater: the energy needed to do work against gravity in order to raise the mass of dirt from the hole and dump it outside to form the 'lip' and 'ejecta' region around the crater (afterwind lofted fallout dust is merely ~1% of the crater mass). This energy is simply E = mgh where m is the cratered mass raised average height h against gravitational acceleration g. Taking this into account means that for high yields h and particularly m both become very large, so that the gravitational work energy needed to form a massive crater is immense and can then exceed that of the explosive break-up of the soil. (For low yields, the gravitational work energy is trivial compared to that used to break up the soil explosively, because of the smaller mass and smaller crater depth.) If the crater diameter to depth ratio is constant, then the cratered mass m is proportional to the cube of the depth h, or m = bh3 where b is a constant, so E = mgh = bh3gh = bh4g. Rearranging, h ~ E1/4 for high yields. There are other factors involved of course, because the amount of energy used for cratering is essentially the downward-directed case-shock energy of the bomb debris (the air blast doesn't have enough density and thus enough momentum to dig out the crater, it just causes some compression). This is a limited fraction of the explosion energy, so the energy utilization in explosively heating, compressing and breaking up the crater material limits the energy available for ejecting it against gravity. This energy balance will usually be accompanied by some change in the ratio of crater diameter to depth, so the craters will not always exactly behave the fourth-power scaling law in the megaton range. Nevertheless, there is a massive exaggeration of high-yield crater sizes in the Effects of Nuclear Weapons 1977 and related documents.
The earliest mainstream American statement made that crater dimensions theoretically scale as W1/4 for the regime in which gravity is important is by Dr Milo D. Nordyke of the Lawrence Radiation Laboratory in Cratering Experience with Chemical and Nuclear Explosives (published in Proceedings of the Third Plowshare Symposium, Engineering with Nuclear Explosives, April 21, 22, 23, 1964, U. S. Atomic Energy Commission report TID-7695, TID-4500 (UC-35), pages 51-53. Nordyke states there on page 52: "... the analysis that leads to W1/3 ignores the action of several factors such as gravity and the strength or internal frictional forces of the medium. ... one can show that their effect would be to lower the exponent and lead toward W1/4 scaling (reference: L. I. Sedov, Similarity and Dimensional Methods in Mechanics, Gostekhizdat Press, Moscow, 1954 and Academic Press, New York, 1959, page 251)."
However, Nordyke did not identify the W1/4 as applying to the gravity regime for large megaton range explosions that excavating large masses of ejecta over large vertical distances against gravity, and the W1/3 law holds for relatively small craters in the sub-kiloton range. Instead, he argued for an interim value of the exponent between the values of 1/3 and 1/4, of about W1/3.4 ~ W0.3 from empirical data for Nevada desert alluvium. This fudge factor leads to inaccurate extrapolations from the Nevada test data.
– L.G. Margolin, et al., Computer Simulation of Nuclear Weapons Effects, Lawrence Livermore National Laboratory, UCRL-98438 Preprint, 25 March 1988, p. 5.
“Recently the U.S. Department of Defense reviewed the pertinent historical evidence gathered during nuclear tests and developed new models of the vulnerability of underground structures to nuclear explosions. These calculations differed substantially from those derived from earlier models. For example, the dimensions of a crater produced by a nuclear explosion were estimated to be considerably smaller than previously thought. To give a specific comparison, the radius of a crater produced by a one-megaton nuclear explosion on the surface of wet soil would be 651 feet according to the old formula, whereas the new formula estimated the radius to be 394 feet. ... Comparable differentials typically hold across the spectrum of weapon yields and soil varieties. ...
“... Under the new formula the pertinent calculations for this location’s geological composition (dry soft rock, according to U.S. analysts) indicate a crater radius of only 180 feet for a one-megaton weapon, or 262 feet for a nine-megaton weapon.”
Notice that an increase in crater radius from 180 to 262 feet for a yield increase from 1 to 9 megatons implies a crater scaling power law of W0.171, i.e. 180(9 Mt / 1 Mt)0.171 = 262 feet.
Holsapple’s online crater scaling program
Keith A. Holsapple has a very nice and useful online crater scaling program at http://keith.aa.washington.edu/craterdata/scaling/index.htm which allows you to predict crater sizes for comet and asteroid impacts, chemical explosives, and also any yield and burst conditions from two types of nuclear weapon design:
(1) “high weight/energy ratio” inefficient low yield devices typical of early kiloton Nevada tests with a mass to yield ratio of 10 kg/kt, and
(2) “low weight/energy ratio” efficient high yield modern thermonuclear weapons with a mass to yield ratio of 0.42 kg/kt).
He also includes TNT, which of course has a massive weight to yield ratio of 1,000,000 kg/kt by definition. The dense explosion debris embeds itself deeply into the ground, delivering energy deeply into the ground far more efficiently than X-rays which just ablate a surface layer and cause a rapidly attenuated ground shock by the recoil from ablation. Efficient (high energy/weight ratio) nuclear weapons release most of their energy initially as X-rays not the kinetic energy of the dense debris shock wave, so they do not couple much energy deeply into the ground to cause a crater. As a result, high yield modern nuclear weapons use a much smaller proportion of their energy for cratering than inefficient low yield weapons or TNT chemical explosive.
K. A. Holsapple and S. Peyton, The Scaling of Nuclear Weapons Effects for Near Surface Bursts, Defense Nuclear Agency report DNA 6543F (1987), and
R. M. Schmidt, K. R. Housen and K. A. Holsapple, Gravity Effects in Cratering, Defense Nuclear Agency report DNA-TR-86-182 (1988).
The approach Holsapple used is the scaling of experimental data through the use of dimensional analysis where the data is allowed to determine the scaling law at high yields, rather than fitting the data to determine coupling constants in a purely physical, mechanistic scaling model based on energy utilization. His equations 6 and 7 show that at low energy yields, the crater size is a stronger function of yield than at higher yields. The low yield limit is called the “strength regime” and crater sizes scale approximately as the cube-root of yield in this regime; at higher yields the scaling is in the “gravity regime” which is a weaker function of yield, closer to the fourth-root. Holsapple in equation 7 gives a “general form with those limits and that interpolates between these two regimes”.
One problem is that he gives no derivation of the interpolative formula 7, and another problem is that the limits for the strength regime and gravity regime are not fixed theoretically as cube root and fourth root scaling in his formula, but are defined by experimental data. This is similar to modelling thermal radiation through the atmosphere by simply modifying the inverse-square law to fit the data, e.g. taking the thermal radiation to fall as say 1/R2.5, instead of adding an exponential term to allow for absorption and scattering by the atmosphere in addition to the inverse square law.
The problem is that we know from physical energy utilization principles that the laws of nature are due to fixed mechanisms and should be fixed theoretically. Variations in the experimental data should be used not to vary the scaling laws provided by the physical mechanism, but instead to determine the physical constants. At low yields, a unit amount of cratering energy excavates a unit mass of soil or rock. If the soil or rock has fixed density, the crater volume at low yields is then directly proportional to the energy yield. By geometry, the radius of a hemisphere is proportional to the cube-root of its volume. If the crater radius-to-depth ratio is a constant, this cube-root law applies to other shapes, too.
Hence, at low yields the cratering theory needs to be tied to the cube-root. At high yields, the influence of gravity is that most of the available cratering energy must be used up in shifting soil or rock out of the massive crater. The energy needed to lift crater mass M up to vertical distance to the lip D against the force of gravity F = Mg is simply E = FD = MgD. This is just a physical fact of nature. Since for a constant crater radius-to-depth ratio, the mass M is proportional to D3, we get E ~ D3D ~ D4, hence at high yields the energy used to overcome gravity predominates. The full equation for the utilization of energy is:
E = AD3 + BD4,
where the first term on the right hand side (containing D3) is the energy needed to hydrodynamically excavate the mass of the crater (this energy is directly proportional to the mass of the crater or to the cube of the crater dimensions), and the second term on the right hand side (containing D4) is the energy needed to overcome gravity and dump the excavated soil on the surrounding ground to form the crater lip and ejecta zone. So this is the simplest way to model craters: just use the experimental data to determine the values of constants A and B. Instead of this energy utilization and physical mechanism based approach, Holsapple allows the experimental data to vary the values of the powers that in fact should not be allowed to vary unless the radius-to-depth ratio of the crater varies.
The crater scaling formula that Holsapple gives allows the excavated volume of the crater to vary linearly with bomb yield at low yields (“strength regime”), correctly giving W1/3 scaling for linear dimensions, but at high yields it gives a scaling law of W{mu}/2 where {mu} should theoretically be equal to ½ from the physical laws of nature as they are known for constant radius-to-depth ratio craters to give the W1/4 scaling law at high yields (gravity regime). By letting {mu} vary according to the explosive and impact cratering data in his database, however, Holsapple gets differing values for {mu}, from 0.41 for dry soil to 0.55 for wet soils, soft rock, hard soil and hard rock. For {mu} = 0.55, the scaling law for the high yield (gravity regime) asymptote will be W0.55/2 = W0.275 instead of the physically defensible W1/4 which is needed for energy conservation! Moreover, the data in Holsapple’s database are mainly data for the strength regime. He doesn’t have strong evidence of a departure from the natural W1/4 scaling law. So we disagree with the scaling procedure unless {mu} is taken as ½ and the experimental data is just used to constrain the values of the other variables in the scaling procedure. The dimensional analysis formula used to interpolate in the all-important transition zone (which spans the most important yield range for nuclear weapons) from strength to gravity scaling, is also suspect, and we would prefer a simple physical prediction system based on energy utilization between the hydrodynamic break up of the ground and the work against gravity in ejecting debris to form the lip and ejecta zone (as outlined in an earlier post, linked here).
However, online calculations using Holsapple's computer program does provide some interesting updates to our information. Holsapple's computer calculation for explosion cratering works by using an equation based on dimensional analysis and data to predict crater excavation volumes for four different kinds of soil: dry soil, wet soil, hard soil/soft rock, and hard rock. The crater excavation volume is constrained to be directly proportional to bomb yield for very low, sub-kiloton yields (the "strength regime", corresponding to cube-root scaling for linear dimensions such as depth and radius) but less than directly proportion to yield for very high yields such as in the megaton range (the "gravity regime", where we argue that the energy to excavate against gravity is E = mgh ~ [volume]*[volume]1/3 ~ [volume]4/3 so that [volume] ~ E3/4, which makes linear dimensions scale as E1/4).
For example, for TNT (not nuclear explosive) surface burst (with the charge half-buried in the ground, so that the centre of the explosion at at ground level), Holsapple's computer program shows that at TNT yields equal to or less than 100 kg, the excavated volume in dry soil is 39,570Wkt cubic metres. But if you increase the yield to 1 kt of TNT explosive, you don't get a crater of 39,570 cubic metres, but only 16,600, because gravity effects are already starting to kick in. This figure of course is bigger than for a nuclear explosion.
Holsapple's model shows that the crater excavation volume for a low weight-to-energy ratio nuclear weapon (0.4186Wkt kg bomb mass) is actually 10 times less than for a high weight-to-energy ratio nuclear weapon (10Wkt kg bomb mass) and is 25 times smaller than the crater volume produced by 1 kt of actual TNT (1,000,000Wkt kg bomb mass).
For example, the crater volume for a 1 kt low mass-to-energy ratio nuclear warhead surface burst on dry soil is 664 m3, compared to 6,640 for high mass-to-energy ratio nuclear warhead, and to 16,600 for actual TNT.
The heavier the bomb mass, the more efficient is the cratering effect, because more energy is carried downwards on dense, high-momentum bomb debris that embeds itself into the ground and delivers energy efficiently, unlike the X-ray surface ablation and the blast wave reflection from the ground, which produce a ground shock but no cratering. For the low mass-to-energy ratio nuclear warhead (which produces the significant smallest cratering action) on dry soil, Holsapple's program gives the following crater excavation volumes as a function of total yield:
Once the volume is calculated by the semi-empirical dimensional scaling equation, the program uses that volume to find the other crater parameters. Holsapple states that the density of dry soil is 1.7 grams/cm3, but calculates the mass of crater ejecta as 80% of that (1.36 grams/cm3) because not all of the crater volume is formed by ejecting material: there is also a soil compression effect below the bomb, and this accounts for the other 20% of the crater mass (which is compressed downward instead of being ejected out of the crater). This 80% figure is applied to all types of soil.
The density of dry soil is 1.70 grams/cm3, but as stated only 80% of the crater volume is ejected so the mass of ejecta per unit volume is 0.8*1.70 = 1.36 grams/cm3. For wet soil, hard rock and soft rock, the density is 2.10 grams/cm3, and the ejected mass to volume ratio is 0.8*2.10 = 1.68 grams/cm3. For hard rock, the mass density is 3.20 grams/cm3, and the ejected mass to volume ratio is 0.8*3.20 = 2.56 grams/cm3.
In all cases of weapon type and soil type, Holsapple's model uses the following relationships to calculate crater dimensions from the crater excavation volume V:
Apparent crater radius, Ra = 1.10V1/3
Rim radius, Rrim = 1.30Ra
Apparent depth, Da = 0.60V1/3
Average lip height, Hlip = 0.17Da
Crater formation time, Tformation = 0.8V1/6/g1/2 where acceleration due to gravity g = 9.81 ms-2 for Earth. (Most of the crater volume is ejected within a couple of seconds for any nuclear explosion, since the time taken is a weak function of yield.)
Information on the distribution of crater ejecta velocities is also provided. For a low mass-to-energy ratio nuclear weapon surface burst on dry soil, 50% of the ejecta exceeds 13.5 m/s for 1 kt or 30.1 m/s for 1 Mt.
For extremely high yields, there is a transition to "complex" craters like lunar craters, having a wide shallow basin and a central peak. Complex craters have their shape because they are too large for all the excavated material to be dumped at the lip; the fallback of ejecta in the centre of the crater is then so substantial it causes a central peak in the middle of the crater.
On the Earth, crater exceeding a rim diameter exceeding 1.77 km for dry soil would start to transition into "complex" craters. Obviously, there is a difference in this between Earth and Moon because there are no significant afterwinds in an explosion caused by an impact event on the Moon: there is a lack of atmosphere. But on the Earth, a large explosion near surface level causes a toroidal fireball to form due to air drag on the sphere, and you then get debris being sucked into the toroidal circulation via a mushroom "stem" above ground zero. On the Moon, which has only one-sixth of the surface gravity of the Earth, the transition from simple to complex cratering occurs at a rim diameter of 8.5 km. These complex craters are more relevant to impact cratering like the K-T event 65.5 million years ago, than to the relatively trivial energy releases of stockpiled nuclear explosives.
Peaceful cratering: the U.S. Atomic Energy Commission’s Project PLOWSHARE
After the fallout from the CASTLE-BRAVO 14.8 megaton Bikini Atoll hydrogen bomb produced media hysteria over the effects of thermonuclear weapons, President Eisenhower responded by ordering the development and testing at Bikini Atoll of REDWING-NAVAJO of the 95 % clean 4.5 megaton hydrogen bomb. Aside from averting collateral damage from fallout in tactical nuclear war to defend Western Europe from invasion by the massive conventional Soviet block armies, this kind of cleaner weapon was also intended for peaceful civil engineering use as a cratering explosive. The first peaceful underground PLOWSHARE test in 1957 was such a success that it convinced America to move above ground nuclear testing underground to avoid fallout radiation hazards.
This plan was to set off 275 relatively clean hydrogen bombs to cheaply (at an estimated cost of roughly one billion dollars, which was cheap compared to the cost of using conventional explosives) create a new sea-level (without any locks) Panama canal in the Darien region, near the border with Colombia. The existing Panama canal has locks and isn’t at sea-level, so it takes a long time for ships to pass through it, making it slow and expensive for ships to use to cross from the Atlantic to the Pacific Ocean.
Above: in order to proof-test nuclear cratering for a new Panama canal, the 30 % fission, 104 kt total yield PLOWSHARE-SEDAN nuclear test was detonated at 635 feet depth (to optimize cratering efficiency and minimize fallout by trapping the radioactive case shock debris in the crater ejecta) in the dry soil of the Nevada Test Site on July 6, 1962. Although SEDAN was a success, the soil around some of the proposed Panama canal routes was not dry soil but saturated clay, which can create a wider, shallower shaped crater than dry soil. Hence, to get the depth required, higher yields than SEDAN would have been required for a new Panama canal. This would have increased the distant blast wave refraction effects (downwind of the high altitude winds), the ground shock (earthquake-type) effect, and fallout (although it is easier to reduce fission yield at very large total yields than very small ones, for instance the 50 Mt Soviet test was only 2-3 % fission). Both the distant blast and fallout effects could have been averted by postponing detonation until the winds were blowing out to sea, but ground shock effects from the large number of simultaneous high yield underground nuclear detonations required might have damaged the nearby existing Panama Canal, depending on the exact route taken, the distance, and the distribution of bomb yields used. The project was finally cancelled in 1971 due to lying propaganda about alleged low-level radiation effects in the popular media.