
Above: rainout radiation dangers from air bursts during rainstorms can in certain cases exceed fallout dangers from surface bursts (for a good summary of rainout predictions models, see: A. Schiff, Problems with Predicting Fallout Radiation Hazard in Tactical Battlefield Situations, Lawrence Livermore National Laboratory report UCRL-51440, ADA385024, 1973). A report by W. K. Crandall, et al., An Investigation of Scavenging of Radioactivity from Nuclear Debris Clouds, Lawrence Livermore Laboratory, UCRL-51328 (1973) found that for 15 miles per hour wind, if the whole of the mushroom cloud from a 1 kt air burst was scavenged by rainfall, the peak gamma dose rate at 10 km downwind would be about 25,000 R/hr and would result in an infinite-time accumulated dose of 25,000 R. They found that at 100 km downwind, the peak dose rate from rainout would be 35-100 R/hr and the infinite dose would be 400-1,200 R. For 10 kt, assuming 100% cloud scavenging by rain, they found that the peak dose rate at 10 km downwind would be 70,000 R/hr with an infinite dose of 50,000 R; for 100 km downwind they found 1,500-2,000 R/hr peak dose rate and 10,000-15,000 R dose. For 100 kt, again assuming that 100% of the cloud is scavenged by rain, they found that the peak dose rate at 10 km downwind is 120,000 R/hr with an infinite dose of 80,000 R; at 100 km the peak dose rate is 4,500-5,500 R/hr and the infinite time dose is 30,000-35,000 R. These are far higher dose rates and doses than can occur from land surface bursts, but they are exaggerations for three reasons: (1) less than 100% of the mushroom cloud will be scavenged by rainout because not every fallout particle will be hit by a raindrop, (2) the mushroom cloud will often (especially for higher yields, such as 10-100 kt) rise above the height of the rainclouds, so that only a fraction of the activity can possibly by hit by rain droplets and carried to the ground unless there is a thunderstorm cloud with rain forming at very high altitudes, and (3) the rainout droplets arriving on the surface with fallout particles embedded in the raindrops will generally carry a large fraction of the fallout activity straight down storm sewers, where the gamma radiation is well shielded underground (by two feet of earth or so) from people on the ground. In other words, there is natural decontamination during rainout, unless the drainage is poor and puddles are left.


For previous posts on the topic of fallout from nuclear tests, see here, here, here, here, here, here, etc. The story is that extensive fallout pattern surveyed from the very first nuclear test, Trinity (a low, contaminating, tower burst on 16 July 1945) was covered up in the 1950 edition of Glasstone's official U.S. Department of Defense Effects of Atomic Weapons, which only gave the upwind fallout pattern (excluding the downwind fallout area!).
That same book did however given extensive fallout pattern data for the underwater test Baker, which was deleted from all future editions (1957, 1962/4, and 1977). I want to examine how land surface burst fallout was dealt with by Glasstone and Dolan's official manual from 1957-77.
Fallout prediction in the U.S. Department of Defense's 'The Effects of Nuclear Weapons'
The September 1950 edition, called The Effects of Atomic Weapons, includes a table of Trinity test dose rates from ground zero (it was 8000 R/hr at 1 hour at ground zero) outwards in the upwind (not downwind) direction, without explaining the larger area contaminated downwind than upwind! (The book does have an appendix about fallout plotting using meteorology, and another appendix about calculating dose rates from deposited activity, but doesn’t predict downwind dose rates.) It also has a sequence of detailed fallout and base surge predictions for underwater bursts, based on Baker test data.
The 1957 and 1962/4 editions each have different detailed prediction methods for 20 kt and 1 Mt surface bursts, based on nuclear test data from the Nevada 1951 surface burst Sugar (1.2 kt), with some clever scaling procedures to interpolate with the Eniwetok 1952 surface burst Mike (10.4 Mt) and the Bikini 1954 surface burst Bravo (14.8 Mt). The 1962/4 editions use additional data from 1954 Castle series and 1956 Redwing series tests, for upwind fallout.
The 1957 Effects of Nuclear Weapons fallout prediction for land surface bursts is based on the then-secret and therefore not cited report by D. C. Borg, et al., Radioactive Fallout Hazards from Surface Bursts of Very High Yield Nuclear Weapons, U.S. Armed Forces Special Weapons Project, report AFSWP-507, Secret – Restricted Data, May 1954, which states on page 8:
"Since the Castle Bravo shot [on a coral reef near Namu Island in Bikini Atoll] may be characterized as a hybrid between a land-surface and a water-surface shot, probably most like the former, its ground zero radiation data [which showed relatively low dose rates compared to the Elugelab Island burst Mike shot data] may not be very representative of a true land-surface detonation. For this reason, the Ivy Mike shot has been used as the primary source of data for scaling of radiation effects in the ground zero [upwind] region.
"The downwind fall-out contours constructed for Castle Bravo were based essentially upon survey data taken on the islands involved in the fall-out region."
The 1957 Effects of Nuclear Weapons data for fallout from 20 kt and 1 Mt surface bursts is therefore based on a scaling-based interpolation between 1.2 kt Sugar data and 10.4 Mt Mike data for upwind fallout, and a scaling-based interpolation between 1.2 kt Sugar and 14.8 Mt Bravo data for downwind fallout (no downwind fallout data for Mike was measured).
The scaling system is to scale the linear dimensions of the fallout pattern by the cube-root of the total weapon energy yield, and to scale the dose rate values of contour by both the cube-root of total yield and directly with the fission fraction of the explosion. This derives from the report: Scaling of Contamination Patterns, Surface and Underground Detonations by C. F. Ksanda et al, USNRDL-TR-1, September 15, 1953 (Secret – Restricted Data). The physical basis of this scaling is that the fallout pattern derives from the mushroom cloud, the radioactive parts of which (smaller than the total visible cloud, which is just water vapour at the edges), scale in vertical and horizontal extent by the cube-root of weapon yield. The fallout pattern is then like a "shadow" of the mushroom cloud, so the linear dimensions scale accordingly as the cube-root of yield, while the dose rates for each contour scale according to the depth of fallout which arrives. This fallout depth of deposit is proportional to the cloud’s vertical extent, scaling as the cube root of yield. The confirmation that this scaling system is rigorous is that the total amount of deposited activity within the fallout pattern should be directly proportional to weapon’s fission yield. The scaling confirms this, since the scaled area activity is the scales area, ie the product of two linear scaling factors or (W^{1/3})^2 = W^{2/3}, multiplied by the dose rate scaling factor, which for constant fission fraction is simply W^{1/3}. This product is [W^{2/3}].[W^{1/3}] = W, proving the physical consistency of this whole scaling system.
The 1962/4 editions of The Effects of Nuclear Weapons are different from the 1957 data as regards the prediction of upwind fallout dose rates, which are based on an internal and therefore non cited report by Frank Cluff of the U.S. Weather Bureau, The Upwind Extent of Fallout from a Large Nuclear Detonation, U.S. Department of Commerce, Weather Bureau, Washington, 20 August 1959. This suggests that the fallout dose rate at any point upwind is like rainfall deposition, being dependent on the duration that the mushroom cloud remains overhead (before it is blown downwind and fallout ends), which is about 30 minutes for Bikini and Einwetok bursts in the megaton range (1-15 Mt).
Page 2 of that report states that the data used is: "estimated from Pacific test data [which] gives the up-wind extent for several dose rate contours as a function of total yield based on a 7 knot [8.06 statute miles/hour or 13.0 km/hour] mean tropospheric wind speed and an 80 percent fission yield."
Clearly, therefore, the test data is for low average wind speeds and high average fission yield.
Figure 9.85 on page 455 of the 1962/4 edition of The Effects of Nuclear Weapons shows Cluff’s illustration of the upwind fallout, but it has corrected from Cluff’s case of 7 knots to zero wind by adding 4.03 statute miles to all of the distances of upwind contamination, and has also had the dose rate contours re-scaled to 50% fission instead of Cluff’s case of 80% fission.
If we examine the actual figures, ignoring terrain roughness (which in the Nevada desert reduced the fallout gamma dose rate at 1 m altitude by about 25%) and self-shielding of the instrument by its own battery bulk and by the person holding it (which reduces the observed reading by about another 25%), taking a 1 Mt fission surface burst in a 15 miles/hour wind with 15 degrees of directional shear with altitude from the surface to the mushroom cloud, the predicted dose rate patterns are in fair agreement for a 1 megaton surface burst.
Glasstone 1957 says (empirically) that the 1 hour reference 3000 R/hr contour extends 22 statute miles downwind; the 1962/4 revision states (empirically) that the distance is 23 statute miles, while the 1977 edition based on Dolan's computer simulations using DELFIC and SEER II fallout models gives a distance of 21 miles (ignoring terrain shielding and instrument response). DELFIC in particular is almost entirely non-empirical; the only 'normalization' or 'manual fiddle' introduced empirically into the code was the proportion of the bomb energy which is needed for cloud rise simulations to be accurate (it was found that setting this proportion at 45% gives the observed cloud rise data). The maximum width of this 1 hour 3000 R/hr contour is stated to be 3.1, 6.0, and 2.9 statute miles in the 1957, 1962/4, and 1977 editions, respectively.
In the case of the 1 hour reference 1,000 R/hr contour, the downwind distances are 40, 42, and 40 statute miles, respectively, using the 1957, 1962/4 and 1977 editions, while the corresponding maximum contour widths are 6.8, 10, and 6.9 statute miles, respectively.
At lower dose rates, disagreements are larger. However, the lethal areas where survival demands evacuation or high protection factors by buildings, are most important. Upwind fallout is a particular problem to predict. Most of the empirical data in DASA-1251 for upwind fallout is wrong because the fallout maps of Eniwetok and Bikini have been mis-scaled, as explained in an earlier post. Correcting this error, and you immediately see that the 1952 Mike surface burst produced way higher upwind dose rates than subsequent tests like 1954 Bravo and 1956 Tewa and Zuni, allowing for yield and fission proportion correction factors.
The Mike test produced more severe upwind fallout because of the way the massive steel bomb container modified the fallout distribution process and resultant particle size distribution. This would not occur with stockpiled warheads.
Glasstone 1957 states that a 1 hour reference dose rate of 10 R/hr would occur 9.35 statute miles upwind from a 1 Mt surface burst under a 15 miles/hour wind. This was reduced to 1.7 statute miles in the 1962/4 edition, but was increased to 5.8 statute miles in the 1977 edition. The upwind radius of the 100 R/hr contour at 1 hour was 3.46, -1.3 (ie, 1.3 miles downwind, not upwind!), and 3.5 statute miles according to the 1957, 1962/4, and 1977 editions. (The reason why the 100 R/hr contour is seen to commence downwind of ground zero in the 1962/4 edition stems from the assumption in that edition, on page 454, that the upwind fallout has an average arrival time of 24 minutes, so that under a 15 miles/hour wind it travels 15 * 24/60 = 6 miles downwind while falling. This model is likely wrong because it employs data from the inaccurately scaled fallout patterns in reports like WT-915, and also because it ignores the toroidal downdraft from the periphery of the rising, expanding, vortex fireball, which is entirely different in dynamics from a steady deposit of fallout from the full cloud altitude under ambient winds.)
It must be emphasised that except at ground zero and upwind, fallout dose rates never reach the the 1 hour reference level, which is an extrapolation dose rate based on the total deposit.
For example, the 1000 R/hr of gamma radiation in air 1 hour exposure rate quoted for 40 miles downwind (from 1 megaton fission surface burst on an ideal surface, neglecting instrument response, under a 15 miles per hour wind with 15 degrees shear), has an average arrival time of about (40 miles)/(15 miles/hour) = 2.67 hours, by which time the dose rate will have decayed by a factor of 2.67^1.2 = 3.24.
Hence, the maximum dose rate actually encountered at 40 miles downwind will be no more than 1000/3.24 = 308 R/hr. Terrain roughness on average ground (away from buildings which provide greater shielding) will reduce this to 70% of the ideal smooth surface value, while the shielding by the body of the person taking the measurement would each reduce this again to 75% or so, thus a person holding a radiac (radioactivity detection, identification and computation) survey meter will measure about 308 * 0.7 * 0.75 = 162 R/hr peak exposure rate. Because the instrument response is roughly the same as the bone marrow dose (the bone marrow being shielded by surrounding tissues which absorb around 30% of the gamma exposure outside the body), the instrument reading in a fallout field can be used to assess bone marrow exposure. The infinite time bone marrow dose there, allowing for a 20% reduction in dose due to the much quicker decay rate after 200 days than the t^-1.2 'standard decay law', will be 4 * 2.67 * 162 = 1727 R. This is 11.5 times the 150 R limit you would want to avoid a severe risk of acute sickness leading to mortality. Hence, you would need a protection factor of 11.5 if you were 40 miles downwind from a 1 megaton fission surface burst. Most British brick houses have that protection or higher, as long as you keep away from the outer walls/windows and away from the roof.
A lot of claims were made during the 1980s that fallout protection factors in Britain were exaggerated by the U.K. Home Office method of assessment, which uses an averaged wall thickness to include window effects, instead of treating the windows separately to the brickwork. However, this ignores firstly that the calculations assumed 1 MeV gamma ray energy, when it is known that thermonuclear weapons emit very reduced mean energy gamma rays due to fractionation and the massive contributions from very soft gamma ray emitters like neptunium-239, uranium-240, uranium-237, etc. (due to non-fission neutron captures in the thick uranium-238 'pusher' around the lithium deuteride secondary in the weapons), and secondly, the official civil defence advice was that after the bomb (but before fallout arrives) people should block up window spaces with whatever they can, such as furniture like bookcases.
If people could not do that, the fallout or rainout is visible wherever it is life-threatening, and people have time to evacuate, in the cross-wind direction. The highest dose rate fallout follows low altitude winds that you can get an idea of at ground level from the motion of low level clouds (or the stem of the mushroom, if it is not obscured by local cloud cover). The fallout from the upper parts of the mushroom cannot be assessed so easily unless the mushroom cloud can be seen from the ground, or satellite derived upper wind data is available. However, that fallout generally produces less intense dose rates, albeit over a wider area.
RAINOUT
Rainout is one topic that was substantially expanded in the 1978 and 1981 page changes to the 1972 originally 'secret - restricted data' manual Capabilities of Nuclear Weapons, edited by Philip J. Dolan, Defense Nuclear Agency, DNA-EM-1. Dolan actually did some of the research on rainout himself while at Stanford Research Institute in the 1970s. (He had much earlier done extensive research on the gamma ray spectra of different fission type fallout mixtures, including the effects of fractionation, the decay rate of the fractionated fallout, neutron induced radioactivity due to non-fission capture of neutrons, etc.)
The action of rainout is to speed up the fallout rate. Either small fallout particles get swept out of the air by much larger raindrops (this process is strictly termed 'washout'), or the raincloud and fallout cloud combine, allowing small fallout particles to be captured - as a result of their diffusion in all directions as a result of Brownian motion - by small water droplets, which naturally grow (by collisions, condensation, and turbulent attachment) into large raindrops that can then fall out of the raincloud very rapidly (this two-stage mechanism is correctly called 'rainout').
Most rainfall occurs from rain clouds at altitudes of 2.5-5 km, i.e., from the altitude range which corresponds to the mushroom top altitude for a 2 kt nuclear explosion at low altitude or surface level. Some rain comes from much higher altitudes due to thunderstorms, but this quite rare.
Rainout poses a fallout danger from low yield air bursts which would not be present in dry weather. This can affect troops and cause collateral damage by exposing civilians to radiation.
Where good drainage exists in well designed cities, the rainout danger is less severe than fallout because most of the radioactivity goes straight down the drains, where the radiation it emits is well shielded from people. Eventually most of the radioactivity ends up in sediments, and a small fraction ends is dissolved and enters rivers and the ocean, where it is diluted to insignificance compared to the natural background radiation from potassium-40.
Quantitative calculations of the rainout doses in have been published in two Lawrence Livermore Laboratory reports:
(1) J. B. Knox, T. V. Crawford and W. K. Crandall, Potential Exposures from Low-Yield Free-Air Bursts, Lawrence Livermore Laboratory, report UCRL-51164 (1971). This report calculates that if the raincloud top is at an altitude of 7.8 km, then the percentage of the nuclear mushroom cloud that is subject to rainout is 100% for 1 kt, 80% for 10 kt, and 0% for 100 kt.
It also estimates the infinite time whole body gamma dose in rads due to rainout (assuming no sheltering, and no run off into drains) at various distances downwind. Assuming that 100% of the mushroom cloud is subject to rainout from 1 kt, 10 kt, and 100 kt free air bursts (which would require thunderstorms for the 10 kt and 100 kt examples, because normal rainclouds are not high enough to completely envelop the mushroom cloud for 10 kt or more), a 40 km/hour wind and 15 degrees diffusive shear (as for Dolan, 1972 and Glasstone and Dolan, 1977), the dose at 10 km, 100 km, and 2,000 km downwind from a 1 kt burst would be 25,000 rads (rainout mean deposition time of 15 minutes after burst), 900 rads (rainout mean deposition arrival time of 3 hours), and 0.05 rad.
For 10 kt, the corresponding figures for the same distances are 50,000 rads (rainout mean deposition time of 11 minutes after burst), 11,000 rads (rainout mean deposition time of 1.9 hours), and 2 rads. For 100 kt, the figures are 80,000 rads (rainout mean deposition time of 10 minutes after burst), 30,000 rads (rainout mean deposition time of 1.6 hours), and 30 rads.
These 100% rainout figures only apply to the rainout occurring locally, within a region with the radius of the mushroom cloud. Rainout obviously can, at most, deposit 100% of the airborne radioactivity. If this happens around 10 km downwind, you get a dose there of 30,000 rads, but you then get a dose of 1,000 rads at 100 km, because the atmosphere will then be clear due to the rainout around 10 km downwind. So heavy (100%) rainout ends the fallout pattern within one mushroom cloud radius. Complete rainout always results, therefore, in relatively small, localized 'hotspots' and not a general increase in doses over massive areas within the sort of fallout pattern you get from a surface burst. Although a warm front can result in gentle rain over a wide area, once all radioactivity is deposited the air is cleared, so no further rainout of that radioactivity can occur.
(2) W. K. Crandall, et al., An Investigation of Scavenging of Radioactivity from Nuclear Debris Clouds: Research in Progress, Lawrence Livermore Laboratory, report UCRL-51328 (1973). This shows that the accuracy of the predictions above is greatest near the explosion where the doses are most serious. Accuracy degenerates at large distances where doses are small and effects are less serious. As the yield increases in reality, the percentage of the cloud which is intercepted by rain falls, so above 100 kt there is no serious rainout threat unless a thunderstorm exists at the time of detonation, downwind from the burst.
However, very close to the burst, rainout radioactivity doses from 1-10 kt air bursts can be nearly six times greater - over a small area equal to the mushroom cloud size - than dry fallout at similar distances from a land surface burst. For example, at 10 km downwind from 1 kt air burst complete rainout can produce an infinite time outdoor dose (ignoring drainage and shielding, as in the above estimates) of 25,000 rads, as already discussed. This is nearly six times higher than the equivalent dry fallout dose of 4,400 rads for a 1 kt land surface burst at the same 10 km distance etc. (using Glasstone and Dolan, 1977).
In the vast majority of cases, however, air bursts would be likely to occur in dry weather and deposit no local fallout, causing no imminent threat to life outside of the area of initial effects. The fallout would take many weeks, months and even years to gradually be deposited at very low dose rates (due to decay and dilution due to mixing and diffusion while being blown right around the world every month or so).
Even if there was heavy rainout, most of the rainwater would carry the tiny radioactive particles (mixed with the rain) straight down drains, and 1 metre of earth shields reduces the intensity of 1 MeV gamma rays by a factor of about 300. In fact, the average energy (and thus penetrating power) of fallout is considerably less than 1 MeV, so protection is quite high when fallout does down the drain.
There is an interesting bibliography of fallout computation by Richard Rowland of Kaman Sciences Corporation, California, Fallout Computer Codes: A Bibliographyc Perspective, U.S. Defense Nuclear Agency report DASIAC-SR-93-022, July 1994, database reference AD-A281 905. Six major fallout computer codes, including DELFIC (discussed in a previous post on this blog) are discussed briefly.
Rowland points out that DELFIC uses a lognormal fallout particle size distribution based on ground collected deposits of fallout from nuclear tests Teapot-Ess (1.2 kt, Nevada, 1955; shallow underground test, 20 metres depth of burst) and Small Boy (1.65 kt, Nevada, 1962; near surface burst at 3 metres above the ground). The DELFIC median particle radius is 123 microns (0.123 mm).
Other fallout prediction models use grossly different values, and so make differing predictions of the fallout distribution: WSEG-10 uses a median size of 60 microns, while DNAF-1 uses a median diameter of 229 microns. All the models use a fallout particle density of 2.6 grams per cubic centimetre. Another source of disagreement is the fireball thermal fractionation effect on the early fallout dose rate (the relative condensation rates of different fission product decay chains at different times after burst while fallout is forming). DELFIC rigorously analyses this by calculating contributions from each decay chain and summing them to achieve total dose rate.
As a result, DELFIC results in 67% of the activity being refractory (i.e., condensing before the silicate carrier material which forms the majority of the fallout mass) and this portion of activity is diffused throughout the still molten carrier material of the fallout particles in direct proportion to particle volume. It is soluble and has constant specific activity (activity per unit mass) regardless of particle size. The other 33% is from volatile fission product precursors (with low boiling points so they condense only after the silicate fallout carrier has already solidified), and this can only condense on the outside surface of fallout particles. As a result, the latter is more soluble and scales as the surface area of the particle not as the volume (i.e., specific activity, activity/mass, for volatile nuclides scales inversely with fallout particle radius).
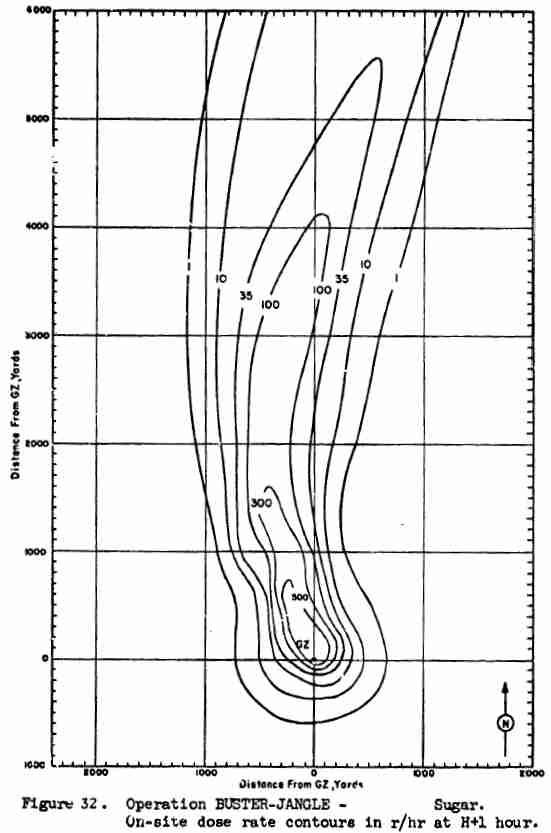
Other fallout models deal badly with this because they ignore the fractionation with particle size and with distance from the detonation. WSEG-10 assumes K = 5180 (R/hr)/(fission kt per square kilometre) at 1 hour after burst, compared to a figure of K = 7770 for SEER3 and 6973 for DNAF-1. All these constant figures are misleading, because fractionation changes this ratio (the composition of the debris depends on particle size) with particle size (and thus with distance) from ground zero. This argument started in the late 1950s. Glasstone's 1957 Effects of Nuclear Weapons stated that the ratio is K = 3,200, the 1962 edition gave a ratio of K = 10,000 and noted that terrain irregularities reduced this by 30%, radiac meter shielding by the operator's body reduced it by another 25%, and only 60% of the fallout occurs locally anyway. Glasstone and Dolan 1977 gave K = 7,500 with the same provisos as the 1962 edition. R. R. Rapp of the RAND Corporation challenged this in his report An Error in the Prediction of Fallout Radiation (RAND report RM-5164-PR, December 1966) when he analysed the data from the 1951 Nevada 1.2 kt surface burst Sugar, which is quite smaller than the fallout prediction for a 1 kt burst in Glasstone and Dolan 1977. For Sugar, K(observed) = 2,330 (R/hr)/(fission kt per square kilometre) at 1 hour after burst, based on the integration of the measured local fallout pattern dose rates over area. Allowing for terrain shielding of deposited radiation by the surface irregularities in a desert (a transmission factor of 0.7) and shielding of the instrument by the person holding it (a transmission factor of 0.75), the for Sugar K(theoretical) = 4,440.
In the 1 kt surface burst Sugar fallout pattern, the 300 R/hr handheld-instrument-measured contour at 1 hour extends only about 1.5 km downwind, and the 100 R/hr contour extends 3.8 km downwind at 1 hour, for a mean vector wind velocity of 46 km/hour. By contrast, Glasstone and Dolan 1977, page 430, predicts a 1 hour dose rate of 3,000 R/hr at 1.5 km downwind for a 24 km/hr wind and 1.8 km downwind for a 46 km/hr wind as in the case of Sugar. Since the Glasstone and Dolan fallout predictions are for a theoretically smooth surface and responsive instrument, their dose rates need to be multiplied by 0.7 for desert terrain shielding and by 0.75 for instrument response when being carried by a person, giving 1,575 R/hr at 1.8 km downwind.
This is still over five times the measured dose rate in the nuclear test. The error is fairly similar for other dose rates. This raises serious concerns that civil defence plans against nuclear terrorism are being based on grossly exaggerated threats, and therefore will probably not be optimal in the event of a disaster.
Interestingly, Rowland also contrasts different assumptions about the decay rate of fractionated fallout, remarking that all the models apart from DELFIC and the EM-1 handbook (1992 edition) use t^{-1.2} for model the dose rate fall with time. DELFIC and EM-1, Rowland states, use a rate equivalent to about t^{-1.26}, this approximation being accurate to within plus or minus 10 percent for times after burst of 15 minutes to 1,000 hours. Obviously this is ignoring the large variations caused by neutron capture in U-238 such as Np-239 and U-237 (which results from the reaction whereby a neutron capture in U-238 is followed by two neutrons being emitted).
There is a complete experimental analysis of the effects of fractionation and neutron induced activity on fallout decay curves in Triffet and LaRivere's weapon test report WT-1317 (1961): highly fractionated (depleted) fallout near ground zero of a land surface burst gamma dose rate decays approximately as t^{-1.2}, but at a few hundred kilometres downwind where there is no significant depletion (and for unfractionated fallout from water surface bursts) the decay rate is approximately t^{-1.26}.
For more information on the dose rate to bomb fraction ratio controversy see the useful report Response to DCPA Questions on Fallout, DCPA Research Report No. 20, 1973 here. For more on the terrain shielding factor in deserts see J. M. Ferguson, Ground Roughness Effects for Fallout-Contaminated Terrain: Comparison of Measurements and Calculations, U.S. Naval Radiological Defense Laboratory, report NRDL-TR-645 (May 1963). Ferguson finds that the terrain roughness in a desert reduces the gamma dose rate by a factor of 0.6-0.7.
To see how such relatively large corrections occur, remember that on a smooth flat infinite surface half the dose rate at 1 m height comes from fallout more than 15 metres away. Then work out the angle that direct radiation from fallout at the mean distance of 15 metres is travelling to you: it is coming to you almost horizontally (only about 12% of the dose rate is from air scattered gamma rays, 88% is direct). Because it is coming almost horizontally from such a large distance, any small irregularities in the ground surface will shield a significant fraction of the radiation. Half the radiation comes from the area of a circle of 15 metres around you, an area of 700 square metres. The bulk of the radiation is not coming vertically upwards from nearby fallout such as that under your shoes, but from a very wide areas horizontally around you.
Another aspect is that if you get in an open trench below the ground surface, you will have a protection factor of about 10 from fallout radiation (i.e., you will be receiving just part of the air scattered exposure coming vertically downwards). The activity in the bottom of the trench is insignificant, just as the activity under your shoes is insignificant as a source of radiation in a fallout field. The significant source is the large surrounding area. Even in a house with no roof or windows and completely contaminated floor area, there will be radiation shielding of the large area contribution surrounding the house. Unlike gas protection, fallout shielding does not require you to keep individual fallout particles outside a house. It is not the ingress of fallout contamination which is the significant issue, but the gamma rays travelling at light speed from a very large area of surrounding ground. Anti-civil defence propaganda claims that houses with broken windows will have no fallout shielding because some fallout particles which are moving horizontally may enter the building, contaminating it. This completely misses the point about radiation shielding.
About 90% of the dose is from radiation coming horizontally from fallout deposited over many hundreds to thousands of square metres surround you. The contribution from fallout deposited under your shoes, or even over the floor of a house, is insignificant in comparison. Misunderstanding this vital point will reduce the efficiency of fallout protection.
A good analysis of this using real fallout experimentally is by C. M. Huddleston, et al., Ground Roughness Effects on the Energy and Angular Distribution of Gamma Radiation from Fallout, U.S. Atomic Energy Commission report CEX-62.81, December 1963. They found that over a cracked but fairly flat dry lake bed the fallout dose rate and angular distribution (using a collimated detector) at 3 ft (0.915 m) height is identical to that at 20 ft height over an ideal smooth surface. Hence the dose rate is 0.67 of that over a smooth surface. For 3 ft above a more rough desert terrain or a plowed field, they found that the dose rate and angular distribution was similar to the ideal theory for 40 ft height, so that the reduction factor was 0.54. Another study using Cs-137 sources for a plowed field gave a reduction factor of 0.45 (C. E. Clifford, Effects of Ground Roughness on the Gamma Dose from Cs-137 Contamination, Defense Research Chemical Laboratories, Report No. 401, Ottawa, March 1963).
***
Review of Jack C. Greene & Daniel J. Strom (Editors, Health Physics Society), Would the Insects Inherit the Earth and Other Subjects of Concern to Those Who Worry About Nuclear War, Pergamon Press, London, 1988, 78pp
This book by Greene and Strom is based on material developed for the Health Physics Society Summer School, 'Health Physics Aspects of Nuclear Attack' held at Southeastern Louisiana University, Hammond, LA, from May 28-June 1, 1984. It is a useful supplement to The Effects of Nuclear Weapons and contains five pages by Philip J. Dolan scientifically discussing the risks of nuclear terrorism (pages 17-21, discussed below).
Jack C. Greene, M.Eng., worked on the Manhattan District at Oak Ridge in World War II, became a member of the U.S. Atomic Energy Commission's Radiation Instrument Branch from 1947-51, and then joined civil defence. From 1962-73 he headed the Post-Attack Research Division of the U.S. Defense Civil Preparedness Agency (DCPA), and in in 1973 he became DCPA's Deputy Assistant Director for Research (see examples of his reports on Fallout Contamination of Food and Water, NATO Civil Defence meeting May 1966 here and Response to DCPA Questions on Fallout, DCPA Research Report No. 20, 1973 here). Dr Daniel J. Strom in 1988 was Assistant Professor of Health Physics, Department of Radiation Health, at the University of Pittsburgh. He received his Ph.D. for dose assessment research in 1984.
Wikipedia comments:
'The strange title of this second book refers to the discovery that cockroaches will withstand 67,500 rem (American variety) or 90,000-105,000 rem (German variety), compared to a human lethal exposure of only about 800 rem [4]. One theory which resulted from these observations on insects was that cockroaches, along with some simple plants and bacteria, would be likely to be the only lifeforms to survive a severe nuclear war. This theory was refuted by experience of the very rapid recovery on isolated islands exposed to close-in heavy fallout and other effects from massive hydrogen bombs at the Bikini Atoll and Eniwetok Atoll, as well as from smaller nuclear weapons in the Nevada Test Site and Australia (Montebello Islands, Maralinga and Emu Field). Full ecological recovery surveys were documented before and after each test series. (For a brief online introduction into some these studies - with specific reference to the ecological effects of the 1.69 megatons Operation Castle Nectar shot, detonated in 1954 on a barge above the crater of the 10.4 megatons Ivy Mike thermonuclear test in Eniwetok Atoll - see [5] and [6].)'
The book has a Foreword in favour of civil defence by Dr Lauriston S. Taylor, Sc.D., of the U.S. National Council on Radiation Protection and Measurements (NCRP). The Biographical Sketches at the end of the book state: 'Dr Taylor has been a leader in the field of radiation protection for more than one-half century, beginning with his appointment as Chairman of the National Committee on Radiation Protection in 1929, and continuing with his position as President of the (renamed) National Council on Radiation and Protection Measurements. He retired in 1977. He is currently [1988] Honorary President of the NCRP. ...'
Dr Taylor's Foreword states: 'I am becoming increasingly convinced that the basic problem centers about the overall ignorance of the general public coupled with an overwhelming deluge of mis-information about some of the simplest facts ... disseminated through our collective media - newspapers, radio, TV, and household magazines.
'Unfortunately, most of the public's information comes through those media which are necessarily highly competitive businesses and must make a profit to survive. By their own admissions, unexciting news is no news, and the often dull and technical discussions associated with Civil Defense make unattractive copy, so they tend to develop and emphasize, often out of context, any unusual, exciting or dramatic tidbits that come to hand ... it is truly amazing how many quickly mount the ladder into full-fledged 'facts'. Even when the right questions are asked, wrong answers are the ones likely to be given, whether through avarice or malice or ignorance. It takes real effort to dig out the real facts.'
On page 40, Dr Howard Maccabee, Ph.D., M.D., responds to the most widespread prejudices:
'I am a radiation oncologist, which means my specialty is cancer. Over the last few years, I have treated over eight hundred cancer patients. In a person's life, or in the family in which it occurs, the experience of cancer, especially if it is a cancer that is not cured, is just as stressful on an individual basis as the event of a nuclear disaster. To my knowledge, of the eight hundred cancer patients that I have treated and that have experienced this stress and grief, there has been only one suicide. The great majority of people, no matter what they have to go through to survive, will fight with every ounce of strength and with every breath to go on living even if they can maintain only a semblance of a quality of life.'
On page 48, Dr Warren K. Sinclair, President of the U.S. National Council on Radiation Protection and Measurements, points out: 'For perspective, according to the 1983 World Almanac, in 1980 there were 1,986,000 deaths in the United States, of which 414,320 were caused by malignant neoplasms (cancers), or about 21 percent.'
A great deal of technical information about alpha radiation hazards in nuclear war is summarised on pages 4-9 by Dr Edward T. Bramlitt, Ph.D., who was the Health Physicist at the Defense Nuclear Agency who was responsible for planning the decontamination of Eniwetok Atoll from 1977-80 after 43 major American nuclear tests there, most of which were surface bursts on barges or islands.
Dr Bramlitt begins by pointing out that although U-235 and U-238 emit alpha particles, they are insignificant compared to plutonium because the shorter half-life of the latter gives it a higher decay rate and hazard. The specific activity (decays per second per kg) of U-235 and U-238 are respectively 30,000 and 190,000 times lower than that of Pu-239, which has a half life of only 24,000 years.
Next, the same basic process which creates Pu-239, ie, neutron capture in U-238 in a reactor and/or in a nuclear explosion, followed by beta decay of U-239 into Np-239 and then into Pu-239, also creates some still heavier isotopes of plutonium such as Pu-240, -241, and -242, due to additional neutron captures. Dr Bramlitt discloses that about 65% of the alpha radioactivity in weapons grade plutonium is from Pu-239, 20% is from Pu-240, and about 15% is initially from Pu-241 (although during storage this rapidly decays, with a 13 years half-life, into Am-241).
Pu-242 is created in non-weapons grade reactor fuel due to its longer irradiation time. The essential point about weapons grade plutonium is precisely the fact that the fuel is removed from the reactor and reprocessed before there has been enough time for much multiple neutron capture, generally after 100 days in the reactor. This maximises the fraction of Pu-239 in the plutonium. Dr Bramlitt points out that neutron capture in U-238 during the nuclear explosion is responsible for the heavy elements in fallout:
'Environmental samples from Rongelap Atoll, which was contaminated primarily by fallout from one thermonuclear weapon test at Bikini Atoll in 1954 [Bravo], were analyzed in 1976 and found to have Am-241 making up about 30 percent of the total alpha activity. ... Pu-241 analyses indicate that Am-241 eventually will comprise about 50 percent of the alpha activity in the Marshall Islands. Following one large nuclear test at Eniwetok Atoll in 1952 [Mike], the amount of Am-241 was reported to be sufficient to eventually account for approximately 80 percent of total alpha activity. ... Pu-238 is a relatively short-lived alpha emitter (88-year half-life) which can be produced by several paths, including (n, 2n) reactions on Pu-239 [ie, the capture of one neutron, followed by the emission of two neutrons]. Pu-238 at Eniwetak Atoll typically accounts for one to ten percent of total alpha activity, although samples associated with some tests showed Pu-238 to be in the range from 30 to 50 percent. ... Bikini and Enewetak samples analyzed in this manner show Pu-240 to account for 50 to 60 percent of combined Pu-239 + Pu-240 activity. ... if 16 nCi are uniformly distributed in the lung and maintained at that level, a dose equivalent rate of 15 rem/yr will result. The maximum permissible concentration in air which leads to this dose rate is 40 picocuries per cubic metre. ... Excess deaths from lung cancers have been observed in studies of animals and people. An excess of neoplasms [abnormal tissue growths, not necessarily malignant] has been found in hamsters at 15 rads of alpha radiation and in a group of miners at cumulative dose to the bronchi of four to nine rads [doses in rads or centigray for alpha radiation are not the same as the dose equivalent in rem or centisieverts because a given dose - energy deposition per unit mass - of alpha radiation is far more ionizing and about more damaging than an equal dose of gamma radiation, so the alpha dose needs to be multiplied by a 'quality factor' of 20 to give the dose equivalent for the purpose of predicting biological effects relative to gamma doses]. A significant excess of lung cancers has been observed in a group of Hiroshima survivors who received 9.8 rads to the lung from gamma and neutron irradiation ... the latent period from radiation exposure to death from lung cancer in people is generally 10 or more years.'
We all use Am-241 in our daily lives, since it is the source used in ionization smoke detectors. The ampha particles emitted by bomb fallout have energy of 5.1-5.5 MeV, resulting in ranges in air of 3.6-4.1 cm. In skin, they have a range of about 35 microns (micrometres), which is less than the average thickness of dead skin on humans, so there is no external hazard from alpha radiation to unbroken skin, and the only risk occurs if contamination enters the body in air, water, food, or through a cut or other damage to skin.
A lung dose rate of 1 millirad per year would result from inhaling air containing 1 femtocurie per cubic metre of alpha emitters like plutonium, or from living in an area where the soil surface is contaminated with 0.2 microcuries per square metre, assuming resuspension of the deposited dust into the air by the wind, and a soil contamination of 13 picocuries per gram in the top centimetre.
Nuclear test data exists for the alpha inhalation risk (page 8). In New York, the Pu-239 concentration in air peaked at 0.45 femtocurie/cubic metre in 1959 (from global fallout after extensive atmospheric nuclear tests by Russia and America in 1958) and peaked at 1.68 in 1963 (from global fallout during even more intense atmospheric nuclear testing by Russia and America in 1962). Because of the cessation of tests at the end of 1962, the air concentration of Pu-239 after 1963 fell rapidly - it was 0.91 in 1964, 0.33 in 1965, and 0.13 in 1966.
The ground deposit of Pu-239 in New York City was also measured: it was 0.2 nanocurie/square metre in 1959 and 0.6 in 1963, rising to 1.5 in 1966. Plutonium soon gets washed out of the atmosphere and enters the deep soil or gets flushed through the drains and enters river or lake deep sediment where it ceases to give rise to biological doses.
Dr Charles J. Bridgman, Professor of Nuclear Engineering at Wright-Patterson Air Force Base, and Dr Arthur T. Hopkins, of the U.S. Air Force, on page 10 disclose that for all nuclear test data for surface bursts, an average of 70% of the radioactivity was distributed throughout the volume of melted fallout particles, and 30% was just on the surfaces of non-melted fallout particles. On page 11 they disclose that the median radius of the lognormal particle size versus activity distribution for low yield surface burst nuclear tests over Nevada desert sand is 50 microns (micrometres) compared to 200 microns for high yield surface bursts on coral rock at Eniwetok and Bikini. The finer the particle size distribution of the natural soil, the smaller the fallout and longer the fallout takes to descend, giving time for much more of the radioactivity to decay in transit during the fallout process before the particles reach the ground. Hence, a nuclear explosion in the air produces no local fallout at all because all the debris condenses into micron-sized particles which take months to years to be deposited, around the world. A surface burst on coarse sand would produce fallout like that from Nevada desert tests, while one on soft rock like coral or limestone would produce larger fallout particles which fallout quickly. A surface burst on hard rock would produce still large fallout particles and faster fallout, some of which would be gravel and rocks, while a surface burst on clay would produce very fine fallout particles more like the global fallout from an air burst. At Hiroshima, the radioactive mushroom had been blown downwind by the time the firestorm with its black rain began 30 minutes to 2 hours later, so there was no significant rainout that contributed to the initial nuclear radiation doses. A firestorm cannot interact with the mushroom cloud because it takes too long to get going.
Dr Conrad V. Chester, of Oak Ridge National Laboratory, on pages 12-13 describes the effects of a nuclear bomb explosion surface burst on a nuclear reactor. A 1-GW nuclear reactor produces 3 kg of plutonium daily. Cooling towers are vulnerable to peak overpressures as low as 1-2 psi, electric power transmission towers and cables can be vulnerable to 3-4 psi if the cables are at right angles to the blast, and auxiliary diesel generators and control rooms may be vulnerable to 25 psi.
However, the pressure vessel containing the nuclear material is very strong and needs an overpressure impulse of about 200 psi-seconds to fracture it, which means a 1 Mt weapon landing at 30-60 metres from the reactor core. If that happens, the core inventory of radioactive material will be added to the nuclear explosion fireball and will add to the fallout. The initial effect is insignificant, since in this case the 1 GW reactor core contents will only increase the 1 Mt bomb gamma dose rate at 1 hour after burst by 1%, but at great times after detonation the reactor debris contribution stands out far more, since it decays more slowly (the short lived nuclides produced in a reactor operating for months are decaying while they are created, but the long lived nuclides accumulate, so the average decay rate of the debris activity surviving from fission in a reactor is slower than the fission product mixture produced in a brief burst in a nuclear bomb).
If a nuclear reactor is hit by 25 psi peak overpressure, the control systems and cooling systems (which rely on auxiliary generators for power if the reactor is shut down) could cause the reactor core to overheat, melt down and may then gradually leak some contamination (this is not the explosive situation which occurred to Chernobyl in 1986). Even when the reactor is shut down, the decaying debris in the core produces a lot of heat which needs to be extracted, unless the design includes an efficient heat sink with natural convection possible.
On pages 17-21, Philip J. Dolan, M.Sc., discusses nuclear terrorism: 'I think it probably is inevitable that a nuclear device will be used by terrorists at some time in the future, either as a serious threat or with an actual explosion ... there is some probability that the acquisition may come about by theft of a weapon rather than by fabrication. ... No doubt, there is enough information available in the open literature to enable a group to build a nuclear warhead ... that would produce somewhere between a few tens of tons and a few kilotons of yield, which would be adequate for their purposes.'
Dolan points out that U-235 is extremely expensive to separate from natural U-238 by gaseous diffusion or centrifuges, while U-233 and Pu-239 must be produced in a nuclear reactor by neutron irradiation of Th-232 and U-238, respectively. The plants required for this would 'probably be beyond the reach of terrorist groups' so theft of nuclear components or of an actual weapon is the major concern:
'Fortunately, the plutonium that is made in power reactors is trapped in the highly radioactive residues of the fuel from which it is made. Plutonium represents only about one-half of one percent of the spent fuel from a light-water power reactor. ... More than a ton of this spent fuel must be processed to obtain enough plutonium for one weapon. ...
'All things considered, it appears that theft of already reprocessed plutonium is the most likely route for the terrorists to obtain the fuel. ... Weapon plutonium typically contains six to eight percent Pu-240 and only trace amounts of Pu-241 and Pu-242. When the reactor is run [for longer periods than when producing weapons grade plutonium] to optimize fuel usage for power production, the heavier isotopes, together with some Pu-238 that is also produced, account for 30 to 35 percent of the plutonium in the spent fuel. Pu-240 and Pu-242 fission spontaneously, producing a continuous neutron background. Pu-241 and [its] daughter products are gamma emitters. ... The neutron background also presents a pre-initiation problem that can significantly complicate the design and production of weapons. ...
'A prime threat would seem to come from some of the smaller countries with relatively undeveloped technological and industrial capabilities. Terrorist activities may appear attractive to the leaders of some of these countries who desire to exert influence beyond their own borders but who lack the military or industrial power to do so. In some cases governments have openly supported terrorist activities, while in other cases strong suspicions of such support exist in spite of denials by the governments concerned. Undoubtedly, some such governments harbor desires for nuclear weapons.'
Dr Robert Ehrlich, Chairman of the Department of Physics, George Mason University, discusses 'nuclear winter' propaganda by 'TAPPS' (R.P. Turco, O.B. Toon, T.P. Ackerman, J.B. Pollack and C. Sagan, Nuclear Winter: Global Consequences of Multiple Nuclear Explosions, in Science, v222, 1983, pp. 1283-92; the acronym TTAPS from the author surnames is deliberately meant to involk the name of the military 'lights out' bugle call, taps) on pages 21-23:
'The postulated drop in temperature following a nuclear war arises due to the blockage of sunlight caused by smoke and dust thrown up into the atmosphere. The smoke arises from fires caused by the nuclear detonations (primarily urban fires), while the dust arises due to the presence of numerous ground burst weapons. ... The rate of rainout of soot and dust depends on the turbulence in the atmosphere. In the TTAPS calculation a kind of temperature inversion results in which there is very little chance for smoke and dust to be removed by rainout. In the actual atmosphere, it seems likely that the patchiness of smoke would cause large thermal gradients and much turbulence leading to a rapid rainout. This effect could lead to a totally negligible temperature decline.
'The large temperature decline in the TTAPS calculation results primarily from smoke rather than dust, since the black soot particles tend to block light more than dust particles. ... In order for 100 megatons to give rise to a large temperature drop, one must assume that 1,000 weapons of 0.1 megaton yield are each delivered against different urban areas causing them all to burn. The TTAPS authors (Turco et al., 1983) recognize this to be a highly artificial scenario ...'
Regarding one 'disastrous' and rather suspect prediction of a 20% reduction in ozone layer thickness by a massive USSR-American nuclear war, the book points out elsewhere that this is merely equal to the natural variations in ozone:
'For purposes of comparison, the effective thickness of the ozone layer during summer is about 20 percent less over Miami than over Seattle.'
Jack C. Greene shows on pages 27-28 how the statistical distribution of fallout over America from a nuclear war would produce a spectrum of dose rate and doses. Assuming that 4,447 megatons of ground surface bursts occurred on the 50 states of the U.S. and had a fission proportion of 50%, that 1 kt of fission products deposited per square mile produces 1,000 R/hr of gamma exposure at the 1 hour reference time over average land with shielding from buildings, people, terrain and ground roughness irregularities, etc., that 80% of the fallout is deposited locally (ie, on the US), and that the land area of the 50 states is 3.6 million square miles, Greene calculates a mean 1-hour dose rate of 500 R/hr. Since the average fallout arrival time for Americans would be 2.25 hours, the mean outside dose over the first four days would be 1,100 R, which is lethal. This is the basic reason why civil defence was needed against fallout in the Cold War.
Using the conversion factor between dose rate and the mean specific activity of Nevada test fallout (5 x 10^14 fissions/gram) on page 20 of Greene's earlier 1973 report, the mean fallout mass deposit over America would be 5 grams per square foot or 54 grams per square metre, which is easily visible. (Similar to pouring 1 kilogram of sugar over a room 4.3 metres wide by 4.3 metres long.) The particles would be felt outside like sand grains bouncing off the hands, arms, and face, and could be heard bouncing off hard surfaces like car roofs, bonnets, and windows.
The statistical variation would not, of course, give everyone 1,100 R. Greene in the 1988 book shows that 10% of the U.S. land area would receive 1-hour dose rates below 110 R/hr and 4-day doses below 170 R, a total of 30% would receive 1-hour dose rates below 220 R/hr and 4-day doses below 330 R, a total of 65% would receive 1-hour dose rates below 520 R/hr and 4-day doses below 830 R, 85% would receive 1-hour dose rates below 990 R/hr and 4-day doses below 1,700 R, and the most contaminated 1% would receive 1-hour dose rates of 1,650-3,300 and 4-day doses of 3,300-10,000 R. (Page 25 of Greene's earlier 1973 report indicates that the maximum dose rates measured at 1 hour after nuclear tests, near ground zero (in the crater and on the lip of the crater) , ranged from 3,000-40,000 R/hr but are not of concern for personnel safety since other lethal effects like blast, heat and initial nuclear radiation would predominate so near ground zero.)
Elsewhere the book shows that the 1 MeV mean gamma ray energy assumed for fallout shielding calculations underestimates the protection factor because that energy is always much higher (more penetrating) than the real gamma ray energy of fallout after nuclear tests, and: 'a group of people sitting back-to-back, and fairly close to each other, would provide a significant amount of "mutual shielding". This would increase the building protection factors by multiplicative factors varying between 1.5 and 3 ... the presence of nearby adjacent structures would provide significant mutual shielding between buildings ... in all cases exposures within structures would be considerably below those predicted for buildings in isolation. Some studies have shown that additional multiplicative protection factors of 2 to 3 are quite reasonable to assume.'
On page 33, Dr Sumner Griffin shows that 75% of all American cattle can be sheltered indoors in barns with food reserves of 85 days on average; the mean protection factor of a barn against gamma radiation is 1.8 if ignoring the mutual shielding of animals by each other and ignoring ground roughness, and the corrected protection factor is about 2.5.
Finally, Dr Kenneth Skrable, Professor of Radiological Sciences at the University of Lowell, explains the mechanism of the neutron bomb on pages 51-2. He explains that the fusion of the hydrogen heavy isotopes deuterium and tritium produces helium-4 plus a neutron plus an energy release of 17.6 MeV, of which 80% (14.1 MeV) is released as the kinetic energy of the neutron and 20% (3.52 MeV) is released as the kinetic energy of the helium atom, leading to the massive neutron radiation and weak fireball of the neutron bomb: 'minimal blast and thermal radiation.'
By contrast, nuclear fission only releases a few percent of the total energy as the kinetic energy of neutrons, so the blast and thermal effects from a predominantly fission weapon exceed those from neutron radiation. Dr Skrable concludes on page 52:
'By replacing fission tactical weapons with neutron weapons, the tactical objective of the weapon will be maintained without the collateral damage and death to civilians outside the area of usefulness. Therefore, the neutron bomb, in fact, may be considered to be a bomb that benefits people, civilian people. ...
'The neutron bomb is a miniature hydrogen bomb. It is to be used as a tactical weapon against invading enemy forces. The civilian population, if ever tactical nuclear weapons had to be employed, should favor the neutron bomb over currently stockpiled fission based tactical weapons.'
The U.S. National Council on Radiation Protection and Measurements (NCRP) Report No. 42, Radiological Factors Affecting Decision-Making in a Nuclear Attack, shows that protracted exposures to radiation - such as fallout - are less dangerous than brief exposure to the same dose. For example, they show that the lethal gamma dose for 50% of humans is 450 R for a week-long exposure, but is about 600 R for a one-month long exposure. Increasing the duration, over which a given amount of radiation is spread, increases the time available for the body's repair mechanisms (both cellular repair and DNA break repair by protein P53) to reduce damage.


Recent email response to a question regarding ozone and nitrogen oxides produced in nuclear tests at high altitude:
ReplyDeleteFrom: Nigel Cook
To: "human being" folhasasombra@gmail.com
Sent: Monday, January 01, 2007 12:13 PM
Subject: Re: ozonosphere layer and high altitude nuclear explosions
Hi,
The red/brown nitrogen dioxide produced above 2000 K in the rapidly cooling shock wave of a nuclear explosion is compensated for by the fact that the intense prompt and other initial gamma radiation of a nuclear explosion ionises the air, creating a vast amount of ozone.
This ozone is entrained and mixed with the nitrogen oxides in the fireball.
Because the ozone created by initial gamma radiation in the surrounding air modifies the spectrum of thermal radiation transmitted, this was intensively studied in the nuclear tests from 1952 onwards where thermal spectroscopy was done.
Depending on the fission yield of the explosion and the altitude of burst, the production of ozone can in general cancel out or exceed the production of nitrogen dioxide.
For example, a high altitude nuclear explosion doesn't produce a shock wave with enough pressure to create nitrogen oxides, but it does create a lot of ozone from the effect of gamma radiation on oxygen.
Hence, such a nuclear explosion will boost the ozone layer, instead of destroying it. All the facts about gamma rays producing ozone were classified up to about 1985 because the detailed thermal spectra of high altitude nuclear explosions are dependent on it, and this is important because thermal ablation is a "kill" mechanism for nuclear ABM interception of ICBM's.
Studies on the thickness of the ozone layer, and of the ozone and nitrogen dioxide content of nuclear fireballs and mushroom clouds from some late tests (including American surveys of Chinese atmospheric test mushroom clouds in the 1970s, after they blew out over the ocean) confirmed that there is no significant overall effect on the ozone layer.
There is a good book compiling the detailed information I have at home, and when I get back I will try to get a post on my blog about ozone and nitrogen oxides produced in nuclear explosions of different types, test data confirming it, and political propaganda Cold War issues on this topic.
The main finding of surveys was that the aircraft Concorde and aerosol CFC propellents in sprays and refrigerators caused the destruction to the ozone layer, and high altitude nuclear tests generally boosted the ozone layer instead of destroying it.
Best wishes,
Nigel
----- Original Message -----
From: "human being" folhasasombra@gmail.com
Sent: Sunday, December 31, 2006 11:29 PM
Subject: ozonosphere layer and high altitude nuclear explosions
Hello Nigel
I saw the blog: Effects of Nuclear Weapons Tests: Scientific Facts (http://glasstone.blogspot.com)
And I have a question for you:
In you opinion, is there a connection between the deplection of the ozonosphere layer, and the 1950's and 1960's tests of high altitude nuclear explosions?
Some specialists have concluded that the heat created by nuclear explosions produces huge quantities of nitrogen oxides in the surrounding air, and these are precisely among the chemicals that could cause significant depletion of the ozone layer.
Ozone concentrations are greatest between about 15 and 40 km.
The following nuclear explosions ocurred within, or near the range of ozonosphere layer (specially: Yucca, Orange, Test #88, Test #115)
USA –Hardtack I – Johnston Atoll, Pacific Ocean
Yucca 28 April 1958, 1.7 kt, 26.2 km
Orange, 12 August 1958, 3.8 Mt, 43 km
USA – Dominic I / Fishbowl– Johnson Atoll, Pacific Ocean
Bluegill Triple Prime, 26 October 1962, 410 kt, 50 km
Tightrope, 4 November 1962, <20 kt, 21 km
USSR – 1961 tests – Kapustin Yar
Test #88, 6 September 1961, 10.5 kt, 22.7 km
Test #195, 1 November 1962, 300 kt, 59 km
Test #115, 6 October 1961, 40 kt, 41.3 km
I'd appreciate it if you'd send me some information regarding internet pages on this specific issue.
Thank you
More information on fallout:
ReplyDeleteMiller, C.F., "Fallout modifications due to unusual burst conditions. Final report", Dikewood Corp., Albuquerque, N.Mex. (USA), AD-A-025020; DC-FR-1219, 1974:
"The possibility of the use of MRV and/or MIRV weapons in attacking a region (such as a system of missile silos) could result in the simultaneous or near-simultaneous detonation of two similar nuclear devices.
"When such detonations take place sufficiently near to each other, the two fireballs will merge and their contents will then co-mingle to form a different or unusual type of fireball and cloud.
"In this study, a previously developed fireball model for these conditions was reviewed and used as a basis for making alterations in the basic fallout model scaling system so that the effect of this type of detonation condition on the fallout hazard may be evaluated."
Miller, C.F., "The analysis and correlation of fallout pattern data. Part two. Derivation of a statistical fallout pattern computational system. Final report", Dikewood Corp., Albuquerque, N.Mex. (USA), AD/A-009815; DC-FR-1216-2, 1973:
"In this report, empirical evaluations of various fallout pattern scaling parameters are summarized and correlations among several of these parameters and certain independent parameters are presented.
"The combined set of evaluated and correlated parameters has been organized to form the construction of a statistical and mathematical model of the process of fallout from near-surface and above-ground detonations of nuclear weapons."
Miller, C.F., "FALLOUT NUCLIDE SOLUBILITY, FOLIAGE CONTAMINATION, AND PLANT PART UPTAKE CONTOUR RATIOS", Stanford Research Inst., Menlo Park, Calif., Report NP-13115, 1963:
"Mathematical formulations for fallout nuclide solubility, foliage contamination, and plant part uptake contour ratios are presented for estimating the degree to which various radionuclides in fallout enter the food chains. The nuclide solubility is determined, for the fallout from a landsurface detonation, mainly by the properties of the soil carrier material at the point of detonation and other conditions of detonation. The major parameters which determine foliage contamination are the size of the deposited particles, the foliage surface density, and the fallout deposit level. The type of leaf surface and its orientation are also factors, but the available data are not adequate to resolve the effect of these two factors on the direct contamination of foliage. Very few data are available on the change in foliar contamination with plant size or age for amimal crops. The plant part uptake occurs by both foliar assimilation or absorption and assimilation through plant roots (for fallout mixed in the soil). Data on foliar assimilation from solid particles deposited on plant foliage and fruits have not been reported. The reported data are from contamination by liquid sprays in laboratory experiments and, indirectly, from world-wide fallout that is deposited mainly in the form of rain drops. Essentially no data are available for making quantitative estimates of food crop contamination by foliar absorption for nuclides in fallout from land-surface detonations. Leaching by rain or washing, the degree of movement of nuclides through the plant, and various plant characteristics are factors which influence the degree of contamination of edible plant parts. The major parameters for uptake in plant parts from the soil are the soluble and available nuclide concentrations in the soil, the plant part surface density, the distribution among the different plant parts, and the type of soil. From the available data, the radioelement having the highest soil uptake contamination factor is Sr-90, the highest values found for the factor are generally for plant leaves and the lowest values are usually for grains or seeds and fruits."
Lane, W.B. ; Sartor, J.D. ; Miller, C.F., "PLANT UPTAKE OF RADIOELEMENTS FROM SOIL", Stanford Research Inst., Menlo Park, Calif., Report NP-13796, 1974:
"A model is presented for predicting food crop contamination by root uptake of fission products from fallout. The model was tested with existing data to obtain equation constants which would permit a solution for a hypothetical contaminating event. Values for many crop-isotope combinations were estimated or assigned because of lack of data. The derived or estimated constants for important agricultural crops are summarized for computer input. Results of a nationwide survey to obtain the exchangeable calcium content of the soil in each country of the United States are presented. The effects of various soil management practices on the ratios and amounts of radionuclides that enter and stay in different parts of the plant are discussed."
Strom, P.O. ; Miller, C.F., "INTERACTION OF FALLOUT WITH FIRES. Final Report", URS Research Co., San Mateo, Calif., Report AD--708558; URS--708-4, 1969: Effects of fires and firestorm winds upon fallout distribution patterns.
Note that the firestorm in Hiroshima started 20 minutes after the detonation, which was the time it took for blast damaged wood frame, bamboo and paper screen filled houses collapsing on to charcoal breakfast braziers to ignite. By that time, 20 minutes after burst, the mushroom cloud of the Hiroshima nuclear explosion had been blown miles downwind, and only a very minor amount of diffused radioactive contamination ended up entering the sooty, moist air from the firestorm which condensed to give a virtually non-radiocative black (soot filled) droplet rainfall when it ascended and expanded into cold air, forcing condensation of the water vapour upon the soot particles.
Anyone can check from the meteorological and aircraft observation data that by the time the firestorm started, the mushroom cloud had been blown away from ground zero and the precipitation of moisture and soot in the firestorm was not fallout.
Measurements of the low levels of radioactivity afterwards prove this true.
Miller, C.F., "THE CONTAMINATION OF MILK BY RADIONUCLIDES IN FALLOUT", Stanford Research Inst., Menlo Park, Calif., Report NP-13432, 1963:
"The major parameters that influence the uptake and assimilation of radionuclides in fallout by animals foraging on pastures are discussed. Equations for a radionuclide assimilation model for the cow and for the concentration of radionuclides in milk are presented, and values of the equation parameters for Sr-89/, Sr-90, Te-132, and I-131 are derived from available reported data. The use of the model is illustrated by a computation of the concentrations of Sr-89, Sr-90, and I-131 in milk and the absorbed dose in humans from consumption of the milk following the contamination of pastures by fallout from an assumed 15-MT yield and surface detonation."
Miller, C.F., "THE RADIOLOGICAL ASSESSMENT AND RECOVERY OF CONTAMINATED AREAS", Naval Radiological Defense Lab., San Francisco, CEX-57.1, 1958:
"The Civil Effects Test Operation Exercise CEX-57.1 following Operation Plumbbob was carried out to obtain information on decontamination procedures that could be used as radiological countermeasures. The test was conducted on D + 1 and D + 2 days after shot Coulomb C. Data were obtained on reclamation of land areas by scraping with a motorgrader, on fire-hosing and scrubbing a concrete-slab roof, and on fire-hosing a composition roof. In addition, some shielding data were obtained for a small building with 6-in.-thick concrete walls and roof. The conceptual nature of a radiological defense system and the role of decontamination or reclamation in such a system are discussed. Most of the report deals with methods for reducing the observed data to interpretive form because the data were taken within a large contaminated area. The decontamination effectiveness in terms of the fraction of contamination remaining was computed. It is concluded that low levels of contamination at the Nevada Test Site could be utilized to advantage to obtain data on gamma -radiation properties, such as the effects of materials and source geometries on the attenuation of fission-product gamma rays. However, higher levels of fall-out in terms of the fall-out particle mass, are required to obtain useful information and training on decontamination techniques; therefore the use of low levels of contamination to conduct studies in this area is not recommended."
Miller, C.F., "ANALYSIS OF FALLOUT DATA. PART I. THE JANGLE "S" AND "U" SHOT FALLOUT PATTERNS", Naval Radiological Defense Lab., San Francisco, USNRDL-TR-220, 1958:
"Fall-out data from Operations Jangle and Castle are analyzed and correlated by use of a graphical method to determine the loci of iso-ionization rate points in the fallout area. The analysis was carried out to determine, from available data, the mass of fall-out asrociated with a given ionization-rate contour so that realistic compositions and amounts of materials could be estimated for reclamation investigations and to determine methods of data analysis and experimental design that could be used to improve the state of knowledge about the fall-out process, A graphical method is described for locating contours, Decay data from Operation Castle are analyzed, and decay corrections for the various kinds of measurements are derived. Decay corrections are applied to sample analysis data and ionization-rate data taken on a number of islands In the Pacific. Fall-out patterns for Castle Operation are constructed."
I want to add some comments about bomb design influences on upwind fallout. I made the remark in the text:
ReplyDelete"The Mike test produced more severe upwind fallout because of the way the massive steel bomb container modified the fallout distribution process and resultant particle size distribution. This would not occur with stockpiled warheads."
The mechanism here is the way that fallout is created in a surface burst from the "case shock" of the weapon (containing all the bomb debris) embedding itself into material streaming upward from the lip of the forming crater, microseconds to milliseconds after detonation.
Approximately 8 times more energy gets coupled into the ground, causing a crater twice as big, in a bomb test using a heavy (inefficient) bomb design, as in an efficient (lightweight) design of identical yield. Hence, crater radii and depths are twice as big for a blast efficient 1 Mt bomb as in an blast-inefficient 1 Mt bomb. The extra cratering energy in a massive bomb reduces the blast and thermal radiation emission at late times, because the dense case shock of compressed weapon debris embeds itself into the ground, mixing the radioactivity with soil both efficiently and at VERY EARLY TIMES after detonation, which creates very efficient fallout creation. If you look at the 1977 edition of Glasstone and Dolan, page 412,
http://www.princeton.edu/~globsec/publications/effects/effects9.pdf
you can see photographs of coral-based fallout particles from the inefficient Mike test at the top of the page, and from a relatively efficient weapon (the 1954 Bravo test using solid lithium deuteride, enriched in lithium-6) at the bottom of the page. (These fallout particle pictures are from a 1965 unclassified USNRDL fallout particle properties summary report by Freiling and Crocker, which in turn is based on classified 1952 and 1954 nuclear test research reports by C. A. Adams of USNRDL.) The autoradiographs on the right hand side show the locations of beta particle emitting fission products and induced activities within the particle. For the Mike typical fallout particle at the top of the page, the particle is a sphere formed from coral transformed by heat to lime (CaO) which has near the surface been slaked by moisture in the cloud to produce a layer of slaked lime (calcium hydroxide). At the very surface of the particle is a thin later of calcium carbonate of the inorganic calcite (non-coral) form, created by the reaction of the calcium hydroxide with atmospheric carbon dioxide during fallout.
Notice that this typical Mike fallout particle contains radioactivity uniformly distributed throughout its volume: the fission products and neutron induced activities from the bomb case have thoroughly mixed with the coral at high temperature during the CRATERING process at Elugelab Island, Eniwetok.
Now consider the lower photo showing a typical Bravo fallout particle originating from the coral reef near Namu Island in Bikini Atoll. Here the fallout particle is an irregular piece of coral swept up from the blasted reef by the afterwinds and contaminated only on its OUTER SURFACE by fission fragments in the rising fireball and mushroom cloud. The specific beta radioactivity (Becquerels/gram at 1 hour after detonation) of this fallout particle is much lower than that of the uniformly contaminated fallout particle from the Mike test. This lower specific activity of LARGE fallout particles in fact seriously affects the upwind fallout pattern dose rates for such particles (which get deposited upwind about 15-30 minutes after a 10-15 megatons nuclear surface burst).
This explains why the scaled dose rates upwind from Mike are so much higher than those from Bravo, despite allowance for wind speeds, total and fission yield, etc.
It's all down to the way that the case shock wave of the weapon embeds itself in the ground more effectively in an "inefficient" (heavy) bomb design, than in a lightweight bomb design.
In a lightweight bomb design, less kinetic energy ends up being carried by the case shock and instead of a powerful case shock of radioactive debris, most energy goes into X-rays. Hence for an efficient bomb (lightweight bomb design) 80% or so of the energy is in X-rays, while in an inefficient heavy design the figure is 10% or less (with the case shock of the weapon carrying most of the energy).
For efficient weapons where most of the energy is initially emitted from the bomb as X-rays (rather than debris shock wave, "case shock"), the fission fragments and other bomb debris do not mix with a large amount of earth while they are at extremely high energy (microseconds to milliseconds after detonation). Instead, of such early mixing of fission fragments and vast amounts of soil, what happens is that X-rays ablate a very thin surface layer of the earth and impart a ground shock via the recoil of ablation (the application of Newton's 3rd law to the thin surface layer which is "steamed" or "exploded" off by the action of very soft i.e. 1-10 keV energy X-rays being stopped by the top few millimetres of the ground surface). Some fission fragments from the debris will interact with this surface layer which is vaporised, but this is only a tiny amount of material, and doesn't form any significant volume of fallout. This material forms small particles which then condense on to the surfaces of large partly-melted coral fragments in the rising fireball and cloud, seconds to minutes after the detonation.
Hence, in a heavy cased nuclear bomb, the case digs deep into the ground and forms totally melted, uniformly contaminated, high-specific activity big particles from times of microseconds to milliseconds after detonation. But in light cased bombs, the main coupling of the bomb to the ground is by X-rays, so the very large particles of fallout are created in a very different way: bomb debris ends up in general being deposited on the outer surface of irregular (not completely melted) grains of earth at times of seconds to minutes after detonation, within the rising fireball/cloud. This occurs at relatively low temperatures, and because debris is only coated on the outer surface of particles, the specific radioactivity of the big fallout particles is much lower.
This means that a nuclear bomb detonated with a heavy metal case (like Mike) will produce dose rates upwind and near ground zero which are larger than those upwind and near ground zero that you obtain from weapons with lighter cases.
The Mike shot was 10.4 Mt total yield but had a large mass, 82 tons, and was inside a building containing a refridgeration plant (the bomb contained a flask liquid deuterium because they had not yet manufactured solid lithium deuteride) on Elugelab Island.
I'm not saying that every large particle from Mike was uniformly contaminated throughout, or that every large particle from Bravo had only surface contamination. These are just the predominant situations. There are some exceptions (such as particles originating from unmelted material sucked up into the Mike fireball at late times, and coral that was originally very close to the casing of the Bravo bomb at late times). However, this is the mechanism involved. The slightly greater role of sea-water being taken up by Bravo test (over a small coral reef area, with more of the fireball over the ocean and lagoon than in the case of Mike) helped to lower the Bravo fireball temperature to 100 C quickly, and ensure that most activity ended up coated on the outer surfaces of unmelted fallout grains rather than uniformly mixed with fallout grains at high temperatures.
The downwind fallout pattern is less seriously affected by the X-ray and case shock cratering phenomena than the upwind and crater fallout dose rates, because those particles remain the the cloud for long times and will pick up all the condensed radioactivity, regardless of whether it ends up only plated on the surfaces of particles, or is uniformly distributed within the particles.
Hello
ReplyDeleteI have question: What is mechanism for upwind fallout deposition? Glasstone, 1977 ed gives the upwind extent of fallout for 1 R/h which is greater than the radius of mushroom cloud for any yeild. Is it not correct that the upwind fallout deposition extent must always be equal (0 m/s wind speed) or less than (u m/s wind speed)the mushroom cloud radius. Please correct my understanding.
Rajvir Singh
Hi Rajvir Singh,
ReplyDeleteThank you for that very important question. Upwind fallout is caused by the downdraft of particles around the outside of the mushroom cloud. There's an updraft in the middle (where the mushroom stem rises) and a downdraft at the outer periphery, which blows down some fallout from the edge, even while the fireball is rising up!
This upwind fallout mechanism was first clearly explained together with proof from close-in fallout particle size data and observations of the toroidal fireball as it rises, in the of the earliest American nuclear weapon test report WT-4, Operation Greenhouse, Fallout Phenomenology, dated 1951, an original of which is located in the British National Archives in Kew, London. It's a green-cover glossy paperback with two columns per page of mechanically typeset text, with each page headed "Secret - Security Information" (this old classification pre-dated the 1954 Atomic Energy Act, which defined "Restricted Data" for the first time).
See also nuclear weapon test report WT-615, which discusses this mechanism in relation to upwind fallout from the 1952 Ivy-Mike upwind fallout data. However, there are errors in the upwind map scales in Castle report WT-915 which are amplified in DASA-1251. You can identify and correct the errors by comparing the fallout maps of the islands to a properly scaled map of Bikini or Eniwetok atoll.
Charles E. Adams et al., U.S. Naval Radiological Defense Laboratory, “Fall-out Phenomenology”, Annex 6.4, Scientific Director’s Report of Atomic Weapons Tests at Eniwetok, August 1951 (later designated Weapon Test report WT-4), 150 copies printed, Secret -Security Information. Page 16 states:
ReplyDelete“Examination of the radiochemical analysis of the fall-out shows that fractionation of the active elements has occurred during the formation of the particles. The relative amounts of strontium and barium are consistently less, in comparison with the other radioactive elements reported, than would be expected from the normal fission-yield distribution ... the strontium isotope most likely to be found in the radiochemical analysis has Kr-89 with a 2.6 min half life for an ancestor. Most of the Kr-89 formed in fission would not have decayed at the time of formation of the spherical particles. Similarly, barium has as an ancestor Xe-140 with a 16 sec half life. From the half lives of their gaseous ancestors, it would be expected that there would be considerably less strontium in the fall-out particles than barium. This is actually the case. The amount of strontium reported varies from about 1 to 7 per cent of what would be expected from the normal yield, while the amount of barium present is about 50 per cent ... Quite a number of individual radioactive particles 5microns in diameter were found in the radioautographs of the fall-out ... It is obvious that the downward velocity of the particles must be affected by some mechanism other than mere gravitational settling ... downdrafts occur around the central rising current and extend out to a distance of several times the diameter of the rising current.” (Emphasis added.)
WT-4 title page
ReplyDeleteHello Nigel
ReplyDeleteThanks for your response. I still have understanding that the upwind fallout extent can not exceed the size of mushroom cloud for still wind condition and will always reduce in size with increase in wind speed. But as per Glasstone 1977 ed (Page 430), the upwind extent for 1 R/h dose rate is 2.6 km, 3.9 km, 5.1 km and 7.5 km for 1 kt, 10 kt, 20 kt and 50 kt yield respectively while the corresponding cloud sizes are 2 km, 2.1 km, 2.2 km and 2.4 km only. Considering the downdraft of particles around the outside of the mushroom cloud, influence of gravitaional force and wind speed on fallout particles this can not be explained. How this larger upwind extent than cloud size can be explained? Please also tell whether upwind fallout formation is possible at the time of explosion i.e. due to blast/shock wave.
Thanks
Rajvir Singh 912225593201
rajvir_singh_yadav@yahoo.co.in
rajvir@barc.gov.in
Hello Nigel
ReplyDeleteThanks for your response. I still have understanding that the upwind fallout extent can not exceed the size of mushroom cloud for still wind condition and will always reduce in size with increase in wind speed. But as per Glasstone 1977 ed (Page 430), the upwind extent for 1 R/h dose rate is 2.6 km, 3.9 km, 5.1 km and 7.5 km for 1 kt, 10 kt, 20 kt and 50 kt yield respectively while the corresponding cloud sizes are 2 km, 2.1 km, 2.2 km and 2.4 km only. Considering the downdraft of particles around the outside of the mushroom cloud, influence of gravitaional force and wind speed on fallout particles this can not be explained. How this larger upwind extent than cloud size can be explained? Please also tell whether upwind fallout formation is possible at the time of explosion i.e. due to blast/shock wave.
Thanks
Rajvir Singh 912225593201
rajvir_singh_yadav@yahoo.co.in
rajvir@barc.gov.in
Hi Rajvir Singh Yadav,
ReplyDeleteThe short answer is that the cloud data in Glasstone and Dolan is nonsense, calculated from the DELFIC cloud rise model circa 1966, which contained all kinds of errors, like failing to obey conservation of energy (allegedly). It's nonsense. The cloud ends up with most of the energy initially in the blast wave (which is soon converted into very hot convective air in and around the fireball, because of the very rapid fall in blast energy density e.g. dynamic pressure with distance). The DELFIC cloud rise model was supposed to be a theoretical treatment, but then they had to "normalize" (fiddle) it against nuclear test data to find the key parameter, the percentage of bomb energy causing the cloud phenomena (fiddling to make the model match the data implied that 45% of the bomb energy must power the cloud rise). It's a bad model, because it doesn't contain a full 3-d simulation of the toroidal circulation effect, which is vital for working out how the internal circulation of gas in the mushroom continues to push the cloud out in big bursts, e.g. where the cloud reaches maximum altitude in just 4 minutes (DASA-1251 data) and the circulation continues with the stem rising and air being pumped out horizontally.
I know that the Glasstone and Dolan data is controversial. If you look at the data for upwind and crosswind fallout from Mike (where the islands southeast were upwind, and those southwest were crosswind from ground zero), Bravo, Yankee, Union, Nectar (correcting the distance scales on the Bikini Atoll maps in WT-915 and DASA-1251 for Castle tests), Tewa, Flathead and Navajo, you see that the upwind dose rates for Mike (after scaling) seem to be 10 times greater than other coral surface bursts like Bravo, and these in turn are about 10 times higher than for sea water surface bursts (barge tests in Bikini Lagoon). However, I recently found some new data on this problem and I'm going to study it in detail. (This historically caused the exaggeration of upwind fallout in Glastsone 1957, which was corrected in the 1962/64 version by a scheme originated by Frank Cluff of the US Weather Bureau in his 1959 paper on Upwind Fallout from Megaton shots, although I fear that Cluff may have been deceived by the inaccurate distance scales in WT-915).
ReplyDeleteI would not place too much reliance on the upwind dose rate predictions in Glasstone and Dolan 1977. While it is to be applauded for trying to use computer models to understand the physics and resolve issues in data, it's terrible to substitute computer models for nuclear test data without publishing a convincing validation of the computer model first.
ReplyDeleteHave you seen American weapon test report WT-1315, OPERATION REDWING - PROJECT 2.61, ROCKET DETERMINATION OF ACTIVITY DISTRIBUTION WITHIN THE STABILIZED CLOUD, PDF linked here:
http://www.hss.energy.gov/healthsafety/ihs/marshall/collection/data/ihp1c/0873_a.pdf,
which shows that the radioactivity is outside the visible cloud in the 3.53 megaton coral surface burst ZUNI test of 1956, which was well surveyed at 7 and 15 minutes by firing rockets (containing ionization chambers and radio telemetary) from Bikini (How) Island through the mushroom.
Also, weapon test report WT-615 shows that fallout particles up to 5 mm in diameter (hail-stone size) were deposited in fallout collectors after Mike shot in 1952.
I'm writing a paper on the upwind fallout problem because of the immense fallout problems for civil defence rescue planning in the blast damaged area. I think secrecy has really made a dogs breakfast of the whole subject in the past. There is no reason for secrecy on a subject that would be so important in the event of an enemy attack, by terrorists or thugs. Having a lack of civil defence competence and confidence just played into the hands of Hitler in the 1930s. Weakness and vulnerability, and a scare-mongered public, brings out the worst side of thugs and dictators, not emphatic kindless and love as the "pacifist" liars repeatedly deceive people into believing. Nobody respects incompetence and a people who want to live in ill-informed ignorance in the false belief that ignorance is strength. That's propaganda. Too much secrecy on matters of survival just encourages threats to emerge in precisely the areas most feared.
There should be a proper fallout prediction system in place and published and properly defended scientifically in advance of disaster, to enable the best shelter or evacuation advice to be implemented without delays and confusion in an emergency.
Kind regards,
Nige