(This post is being revised, corrected and updated as of 8 August 2009. Greek symbols for density, Pi, etc., will just appear as p in some browsers which do not support the character sets. The page displays correctly in Internet Explorer 7.)
 ABOVE:
 peak overpressures in psi (pounds/sq. inch; 1 psi = 6.9 kilopascals, kPa) with distances scaled by the cube-root of yield to apply to a standard reference total yield of 1 kiloton. All tests shown are surface bursts, 1 kt to 14.8 Mt, which have an effective blast yield of about 1.68 times that in a free air burst (an air burst in sea level air well away from any solid reflective surface). Data from
WT-934 (1959), page 29, and have been scaled to 1 atmosphere ambient air pressure and 20 C ambient air temperature.
A shock wave is caused by the rapid release of either compressed fluid or energy, explosively heating and compressing fluid. A ‘blast wave’ is a shock wave in air, a compressed shock front accompanied by a blast of outward wind pressure. The shock front has an abrupt pressure rise because the air at the shock front is travelling into cold air which reduces its speed, while the hot air inside the shock front moves out faster, catching up with it to converge in the wall of compressed air. Within this the overpressure region or shock front, wind travels outward from the explosion, but within the inner area of low pressure, wind blows in the opposite direction, towards ground zero, allowing the return of air into the partial vacuum in the middle. At any fixed location, the blast first blows outward during the overpressure phase, and then reverses and blows inwards at a lower speed but for a longer duration during the ‘suction’ phase. Overpressure, p, acts in all directions within the shock front and is defined as the excess pressure above the normal atmospheric pressure (which is on average 101 kPa or 14.7 pounds per square inch at sea level). Dynamic pressure, q, acts only in the direction of the outward or reversed blast winds accompanying the shock wave, and is the wind pressure, exactly equivalent to a similar gust of wind with the same velocity and duration.
The blast wave must engulf, heat and compress all of the air that it encounters as a result of its supersonic spherically divergent expansion. Consequently, its energy is continuously being distributed over a larger mass of air that rapidly reduces the energy available per kilogram of air, so the overpressure drops rapidly. Some energy is lost in surface bursts in forming a crater and melting a thin layer of surface sand by conduction and radiation. Initially the shock front is also losing energy by the emission of thermal radiation to large distances. When the blast wave hits an object, the compressed shock front exerts an all-round crushing-type overpressure, while the outward blast wind contributes a hammer blow that adds to the overpressure, followed by a wind drag to roof materials, vehicles, and standing people. The total force exerted by the blast is equal to pressure multiplied by exposed surface area, but if the object is sufficiently rigid to actually stop and reflect the shock wave, then it collides with itself while being reflected, reducing its duration but increasing its peak pressure. P. H. Hugoniot in 1887 derived the basic equations governing the properties of a gaseous shock wave in a piston, relationships between density, pressure and velocity. Lord Kelvin later introduced the concept ‘impulse’ (the time-integrated pressure of a fluid disturbance), when he was working on vortex atom theory.
The peak pressure in the air blast wave has 4 contributions: the ambient pressure, the isothermal sphere, the shock front and the sonic wave. These are represented by terms including the factors P0, 1/R3, 1/R2, and 1/R, respectively, where P0 is the ambient (normal) air pressure at the altitude of interest and R is the distance from the explosion. The equation of state for air gives the base equation for the total pressure, P = (g - 1) E/V, where g = 1.4 is the ratio of specific heat capacities of air (at high temperatures it can drop to 1.2 owing to the vibration energy of molecules, while molecular dissociation into atoms increases it towards 1.67, for a monatomic gas; these two offsetting effects keep it at 1.4), E is the total blast energy and V is the blast wave volume. We now discover a generalised summation using dimensional analysis that automatically includes all of the four separate blast wave terms, already discussed
P= å {[(g- 1)E/V]n/3P01 –(n/3)}, where the summation is for: n = 0, 1, 2, and 3.
For a free air burst, V = (4/3)p R3, so for g = 1.4, R in km, and blast yield X kilotons:
P = P0 + (0.00737X1/3P02/3/R) + (0.0543X2/3P01/3/R2) + (0.400X/R3) kilopascals (kPa).
For high altitude bursts, the air pressure at altitude H km is P0 = 101e-H/ 6.9 kPa. For sea level air, P0 = 101 kPa, so the peak overpressure, p = P – P0, is:
p = (16.0X1/3/R) + (2.53X2/3/R2) + (0.400X/R3) kPa
For direct comparison, the peak overpressure graph for American sea level free air bursts (DNA-EM-1, 1981, and The Effects of Nuclear Weapons, 1977, Fig. 3.72) implies:
p = (3.55W1/3/R) + (2.00W2/3/R2) + (0.387W/R3) kPa,
where W is the total weapon yield in kilotons. In deriving this formula, we produced fits to both the surface burst and free air burst curves, and averaged them to find an effective yield ratio of 1.68 for surface bursts to free air bursts (due to reflection by the ground in a surface burst, which results in a hemispherical blast with nearly double the energy density of a free air burst, with some energy loss due to surface interaction effects like melting the surface layer of sand into fused fallout particles, ground shock and cratering). This comparison of theory and measurement shows close agreement for the 1/R2 and 1/R3 high overpressure terms, where the exact blast yield fractions are 0.703 and 0.968, respectively. The fraction of the explosion energy in blast is highest at high overpressures where the shock front has not lost much energy by radiation or degradation; but for the weak or sonic blast wave (1/R term) the fraction is only 0.0109 owing to these losses. The American book, The Effects of Nuclear Weapons (1957-77 editions) gives a specific figure of 50% for the sea level blast yield, but this time-independent generalisation is a totally misleading fiction. It is obtained by the editors of the American book by subtracting the final thermal and nuclear radiation yields from 100%, neglecting blast energy that is dissipated with time for crater excavation, fallout particle melting, and the massive cloud formation. Initially, almost all of the internal energy of the fireball goes into the blast wave, but after the thermal radiation pulse, the blast or sonic wave eventually contains only 1.09% of the energy.
Note that the revised EM-1 manual and its summary by John A. Northrop, Handbook of Nuclear Weapons Effects (DSWA, 1996, p. 9), suggests a formula for free air bursts which has differences to that given above. Northrop's compilation and Charles J. Bridgman's Introduction to the Physics of Nuclear Weapons Effects, DTRA, 2001, p. 285) give for a free air burst:
p = (0.304W/R3) + (1.13W2/3/R2) + (1.00W1/3/[RA]) kPa,
where W is the total weapon yield in kilotons, R is in km, and A = {ln[(R/445.52) + 3*exp(-{R/445.52}1/2/3)]}1/2. Bridgman gives a graph of peak overpressures (Fig. 7-6 on p. 285) showing 500 kPa peak overpressure at 100 m, 30 kPa at 400 m, and 8 kPa at 1 km from a 1 kt (total yield) nuclear free air burst. [1 psi = 6.9 kPa.] He also reproduces the curves for dynamic and overpressure positive phase duration, Mach stem height, etc., from chapter 2 of Dolan's DNA-EM-1.
An alternative, simpler equation summarizing data on free air burst peak overpressures was presented in 1957 by the U.K. Home Office Scientific Advisory Branch physicist Frank H. Pavry in his paper 'Blast from Nuclear Weapons', in U.K. National Archives document HO 228/21 Report of a course given to university physics lecturers at the Civil Defence Staff College 8-11 July 1957:
P = (2640/R)*(1 + 500/R)2.4 psi,
where R is distance in feet (notice that 2640 feet is half a statute mile, 5280 feet). The numerical constants in this formula were only approximate in 1957, but it may be possible to update them with modern data.
The low energy in the blast wave at long ranges is consistent with the fact that the physically accurate cloud rise model in Hillyer G. Norment's report DELFIC: Department of Defense Fallout Prediction System, Volume I - Fundamentals, Atmospheric Sciences Associates, DNA-5159F-1 (1979) finds that for the mushroom cloud expansion observed it is required that 45% of the bomb yield ends up as the hot air in and surrounding the fireball (dumped from the back of the blast wave) which produces the convective mushroom cloud phenomena. This 45% figure is mainly blast wave energy left behind by the blast wave in the air outside the visibly glowing fireball region. If the blast wave energy remained in the shock front indefinitely, then there would be no mushroom cloud phenomena because the vast amount of energy needed wouldn't be available to cause it! That doesn't happen: the blast wave irreversibly heats up the air it engulfs, and continually dumps warmed air from the back of the blast wave which moves back into the near vacuum towards ground zero, causing the reversed wind direction (suction) phase, while the shock front is still moving outwards. The energy of the heated air forming these afterwinds is the main contributor to the mushroom cloud rise energy.
In a land surface burst, the blast volume for any radius is only half that of a free air burst, because the blast is confined to a hemispherical shape rather than a sphere. Therefore, in the event of an ideal, rigid, reflecting surface, the blast would be identical to that from a free air burst with twice the energy, or 2W. The effective yield of a surface burst on land or water, as determined from 70 accurate measurements at 7 American tests conducted in the Nevada and at Eniwetok and Bikini Atolls from 1951-4 (Sugar, Mike, Bravo, Romeo, Union, Yankee and Nectar), for scaled distances equivalent to 55-300 m from a 1 kiloton burst, is actually only 1.68W. Hence, about 16% of the energy of a surface burst goes into the ground/water shock wave, crater, and in melting fallout or vaporising seawater: if a sea level air burst has an effective blast yield of 50%, a surface burst has a blast yield of only 50*(1.68/2) = 42%.
Close to detonation, the fireball arrival time is theoretically proportional to (radius, r)5/2, but at great distances blast arrival time is equal to (r/c) – (R/c), where R is the thickness of the blast wave or head start and c is the sound velocity (this incorporates the boost the blast wave gets early on while it is supersonic). Using 1959 weapon test report WT-934 data from Sugar, Mike, and Operation Castle surface burst nuclear tests, with cube-root scaling of both the arrival times and distances [cube-root scaling is as (yield)1/3] to 1-kt, we combine both rules to obtain generalised, universal blast arrival time formula for 1-kt surface bursts:
t = r / [0.340 + (0.0350/ r3/2) + (0.0622/ r)] seconds,
where r is in km and the term 0.340 is the speed of sound in km/s. To use this equation for other yields (or for air bursts) it is just necessary to scale both the time and distance down to a 1-kt surface burst blast equivalent using the cube-root scaling law.
When a nuclear weapon is air burst, the blast wave along the ground is modified by the surface reflection (Nevada desert terrain reflects 68% of the blast energy) in which the reflected blast moves through air already heated by the direct blast, so moving faster and merging with it. The total energy of this merged blast wave will therefore be 1 + 0.68 = 1.68 times that in a free air burst at a similar distance in infinite air. Because the range of any blast pressure is proportional to the cube-root of the energy, this means that in a surface burst the ranges of the merged blast wave (Mach stem) will be (1.68)1/3 = 1.19 times greater than for a free air burst. This increase was observed in ordinary TNT bursts; but in nuclear explosions there are two further factors of importance, first seen at the 1945 Trinity test. First, nuclear bursts emit thermal radiation that heats the surface material, in turn heating the surface air by convection and allowing the blast wave to travel faster along the ground at higher overpressure. Hence, British nuclear test measurements of overpressures made with sensors on the tops of towers gave lower readings than American instruments close to the ground. Second, thermal radiation explodes the silicate sand crystals on a desert surface, like exploding popcorn, creating a very hot cloud of dust about 2-3 m high, called the ‘thermal layer’.
The blast ‘precursor’ which was filmed around the fireball in the 1945 Trinity nuclear test was caused by thermal radiation pop-corning the desert sand into a cloud of hot gas through which the blast wave then moved faster than through cold air (because hot air adds more energy to the blast than cold air). The density of the dust loading in the precursor increased the fluid (air) inertia, reducing the peak overpressure but increasing wind (dynamic) pressure (which is proportional to density). American measurements on the precursor blast in Nevada tests Met, Priscilla, and Hood allowed development of a mathematical model in 1995 which includes thermal pop-corning (blow-off) of the desert surface, thermal layer growth, blast modification and the prediction of precursor effects on the waveforms of overpressure and dynamic pressure. This model was produced in secret for section 2 of Chapter 2 in Capabilities of Nuclear Weapons, EM-1: ‘Air Blast over Real (non-ideal) Surfaces’.
When the blast travels through this layer it billows upwards to 30 m in height, and the overpressure is actually reduced to 67% of normal because the mass of dust loading increases the air’s inertia. But the dynamic/drag pressure is increased by several times because it is proportional to the new higher air density (including dust), and dramatically increases ranges of destruction to wind-drag sensitive targets! This occurs in surface bursts of over 30 kt yield and in air bursts within 240W1/3 m of silicate or coral sand, where W is yield in kt; precursors occurred over coral islands in the 14.8 Mt Bravo test of 1954. The maximum ground range to which precursors are observed in bursts over sandy ground is 350W1/3 m. No precursor has been observed over water or ground covered in white smoke. Concrete, ice, snow, wet ground, and cities would generally reflect the thermal flash and not produce a thermal precursor. The precursor is most important at high overpressures where the thermal heating effect is greatest: no precursor or blast pressure change effect occurs below 40 kPa peak overpressure. A precursor will reduce a predicted 70 kPa peak overpressure to 84%, will reduce a predicted 85 kPa to 80%, will reduce 140 kPa to 75%, and will reduce predicted 210-3,500 kPa to 67% (Philip J. Dolan, ‘Capabilities of Nuclear Weapons’, Pentagon, DNA-EM-1, Fig. 2-21, 1981).
In 1953, interest focussed on the increased drag damage due to vehicles and wind sensitive targets exposed to the precursor from the Grable test. In 1955 it was discovered at the Teapot Nevada tests that the temperature of the precursor dust cloud reached 250 C at 40 milliseconds after the arrival of the blast wave (U.S weapon test report WT-1218). The hot precursor dust burned the skin of animals in an open shelter (protecting against thermal radiation) at 320 m from a 30-kt tower burst (report WT-1179). Japanese working in open tunnel shelters 90 m from ground zero at Nagasaki reported skin burns from the blast wind, but their overhead earth cover shielded out the radiation. At 250 C, skin needs exposure for 0.75 second to produce skin reddening, 1.5 seconds to produce blistering, and 2.3 seconds to cause charring (at 480 C, these exposure times are reduced by a factor of 10).
Small rain or mist droplets (0.25 cm/hour rainfall rate) and fog droplets are evaporated by the warm blast wave, reducing the peak overpressure and overpressure duration each by about 5 %. This was observed in TNT bomb tests in 1944 (Los Alamos report LA-217). Large droplets in heavy rainfall (at 1.3 cm/hour) are broken up by the blast before evaporating, which causes a 20 % reduction in peak overpressure. This was observed when heavy rainfall occurred over part of Bikini Atoll during the 110 kt Koon nuclear test in 1954; comparison of peak overpressures on each side of ground zero indicated a 20% reduction due to localised heavy rain (report WT-905).
Dr William Penney who measured blasts from the early American nuclear tests and was test director during the many Australian-British tests at Monte Bello, Emu Field and Maralinga, in 1970 published the results (Phil. Trans. Roy. Soc. London, v. 266A, pp. 358-424): ‘nuclear explosives cause the air near the ground to be warmed by heating through the heat flash.’ This has two important implications that are ignored by the American publications on blast. First, since the heat flash scales more rapidly than the cube root of yield (which is used for blast), the thermal enhancement increases out of step (so test data from 30-kt bursts show more thermal enhancement than 1-kt tests). Second, Penney had blast gauges both at ground level and on poles 3-m above the ground in Maralinga, where there was red desert soil that readily absorbed the heat flash. The peak overpressures at ground level are significantly higher than at 3-m height. The average pressure, causing the force loading and the damage, to a 10-m high building is therefore less than that measured at ground level.
At 408 m a 1-kt burst at 250-m altitude, Penney points out that his scaled data for a marked thermal layer effect (red desert soil) gives 58-kPa, whereas the American government manual gave 77-kPa for ‘nearly ideal’ conditions, an increase of over 30%. Penney’s data for no thermal effect gave 71-kPa, indicating that the American test data had been scaled down from a higher yield than the British test, where thermal heating was greater. Ignoring thermal flash absorption for the short ranges of interest, the thermal energy ranges scale in proportion to W/r2 where W is yield and r is distance, while the blast ranges are scaled by W1/3, so the thermal energy received at any given scaled blast range varies as W/(W1/3)2 = W1/3. Therefore, when serious thermal heating occurs, the peak overpressures scale up with yield in addition to distances. There is little effect in a surface burst (unless the fireball is very large) because thermal is then emitted parallel to the ground and is not absorbed by the ground, and American high yield tests occurred over transparent water which did not heat up at the surface. A 10-Mt air burst detonation over dark coloured ground would deposit 10 times as much thermal energy on the ground at the scaled blast ranges measured for 10-kt tests in America and Australia, so there would be much greater thermal enhancement of the blast ranges.
In addition to this fact about blast data analysis from nuclear tests, there is another point made by Penney. The blast wave cannot cause destruction without using energy, and this use of energy depletes the blast wave. The American manuals neglect the fact that energy used is lost from the blast. Visiting Hiroshima and Nagasaki, Penney recorded accurate measurements of damage effects on large objects that had been simply crushed or bent by the blast overpressure or by the blast wind pressure, respectively. At Hiroshima, a collapsed oil drum at 198 m and bent I-beams at 396 m from ground zero both implied a yield of 12-kt. But at 1,396 m data from the crushing of a blue print container indicated that the peak overpressure was down by 30%, due to damage caused, as compared to desert test data. At 1,737 m, damage to empty petrol cans showed a reduction in peak overpressure to 50%: ‘clear evidence that the blast was less that it would have been from an explosion over an open site.’
A similar pattern emerged at Nagasaki, with close-in effects indicating a yield of 22-kt and a 50% reduction in peak overpressure at 1,951 m as shown by empty petrol can damage: ‘clear evidence of reduction of blast by the damage caused…’ If each house destroyed in a radial line uses 1 % of the blast energy, then after 200 houses are destroyed, the blast will be down to just 0.99200 = 0.13 of what it was before, so 87 % of the blast energy will have been lost in addition to the normal fall in blast pressure due to divergence in an unobstructed desert or Pacific ocean test. You can’t ‘have your cake and eat it’: either you get vast blast areas affected with no damage, or you get the energy being used to cause damage over a relatively limited area. The major effects at Hiroshima in the horizontal blast (Mach wave) zone from the air bursts were fires set off when the blast overturned paper screens, bamboo furniture, and such like on to charcoal cooking braziers being used in thousands of wooden houses to cook breakfast at 8.01 am. The heat flash can’t set wood alight directly, as proved in Nevada tests: it just scorches wood unless it is painted white. You need to have intermediaries like paper litter and trash in a line-of-sight from the fireball before you can get direct ignition, as proved by the clarity of ‘shadowing’ remaining afterwards (such as scorch protection of tarmac and dark paint by people who were flash burned). In general, each building will absorb a constant amount of energy from the blast wave (ranging from about 1 % for wood frame houses to about 5 % for brick or masonry buildings) despite varying overpressure, because more work is done on the building in causing destruction at higher pressures. At low pressures, the building just vibrates slightly. So the percentage of the blast energy incident on the building which is absorbed irreversibly in heating up the building is approximately constant, regardless of peak pressure. Hence, the energy loss in a city of uniform housing density is exponential with distance, and does not scale with weapon yield. Therefore, the reduction in damage distances is most pronounced at high yields.
Mathematical representation of ideal pressure-time curves
In general, Dr Brode’s empirical and semi-empirical formulae are extremely useful, but there are problems when it comes to the pressure-time form factors. Brode uses the sum of three exponential terms to represent the family of pressure-time curves in the positive (compression) phase for a location receiving any particular peak overpressure. The issue we have with Brode is that the analytically correct physical theory gives a much simpler formula, and this illustrates the issue between the use of computers and the use of physical understanding. The time-form graphs given by Brode in his 1968 article do not correlate with the formulae he provides or with Glasstone and Dolan 1977, although they do correlate with Glasstone 1962/4.
The general form of Brode’s formula is like Pt = Pmax (1 – t/Dp+)(xe-at + ye-bt + ze-ct). The decay constants like a, b and c are themselves functions of the peak overpressure. It is thus very complex. Pt is the time-varying overpressure, Pmax is the peak overpressure, t is time measured from blast arrival time (not from detonation time!), and Dp+ is the positive phase overpressure duration.
Now consider the actual physics. The time decay of overpressure at a fixed location while the blast wave passes by in a shock-tube (a long, uniform, air filled cylinder) where the blast is unable to diverge sideways as it propagates, is Pt = Pmax (1 – t/Dp+)e-at. In a real air burst, however, the pressure decays additionally by divergence with time as air has another dimension in which to fall off (sideways). This dimension is the transverse dimension, i.e., circumference C, which is proportional to the radius r of the blast by the simple formula C = 2pr. In other words, as the blast sphere gets bigger, the pressure falls off everywhere because there is a greater volume for the air to fill. We are interested in times not radii or circumference, but blast radius is approximately proportional to the time after detonation. Hence, we can adapt the shock-tube blast decay formula for the additional fall caused by sideways divergence of the expanding blast by dividing it by a normalised function of time and pressure (unity is added in the denominator because t is time after blast arrival, not time after explosion):
Pt = Pmax [(1 – t/Dp+)e-at] / [1 + 1.6(Pmax /Po).(t/ Dp+)]
This formula appears to model the pressure-time curves accurately for all peak overpressures (a ~ 0 if just considering the positive or compression phase, Po is ambient pressure). The fall of the wind pressure (dynamic pressure), q, is related to this decay rate of overpressure by standard relationships discussed by Glasstone and Dolan for the case where g= 1.4: qt = q (Pt /Pmax)2[(Pmax + 7Po)/ (Pt + 7Po)].
Cratering problems
From an earlier post:
‘Data on the coral craters are incorporated into empirical formulas used to predict the size and shape of nuclear craters. These formulas, we now believe, greatly overestimate surface burst effectiveness in typical continental geologies ... coral is saturated, highly porous, and permeable ... When the coral is dry, it transmits shocks poorly. The crushing and collapse of its pores attenuate the shock rapidly with distance ... Pores filled with water transmit the shock better than air-filled pores, so the shock travels with less attenuation and can damage large volumes of coral far from the source.’ – L.G. Margolin, et al., Computer Simulation of Nuclear Weapons Effects, Lawrence Livermore National Laboratory, UCRL-98438 Preprint, 25 March 1988, p. 5.
The latest crater scaling laws are described in the report:
R. M. Schmidt, K. R. Housen and K.A. Holsapple, Gravity Effects in Cratering, DNA-TR-86-182, Defense Nuclear Agency, Washington D.C., 1988.
In the range of 1 kt – 10 Mt there is a transition from cube-root to fourth-root scaling, and the average scaling law suggested by Nevada soil and Pacific coral Atoll data, W0.3 (used by Glasstone and Dolan) was shown to be wrong in 1987 because empirical data was too limited (the biggest Nevada cratering test was Sedan, 104 kt) and the W0.3 empirical law ignored energy conservation at high yields, where gravity effects kick in and curtail the sizes predicted by hydrodynamic cratering physics.
The W0.3 scaling law used in Glasstone and Dolan 1977 is false because it violates the conservation of energy, used by the explosion in ejecting massive amounts of debris from the crater against gravity. The yield-dependent scaling for crater dimensions (radius and depth) transitions from the cube-root of yield scaling at low yields (below 1 kt) to fourth-root at high yields, because of gravity. At low yields, the fraction of the bomb energy used to physically dump ejecta out of the crater against gravity (to produce the surrounding lip and debris) is trivial compared to the hydrodynamic energy being used used to physically break up the soil. But at higher yields, the fact that the crater is deep means that a significant amount of bomb energy must now be employed to do work excavating earth against gravity.
Consider the energy utilisation in cratering. The total energy done by cratering is the sum of the hydrodynamic energy and gravitational work energy. The hydrodynamic term is shown to be proportional to the cube of the crater radius or depth, as shown by the reliability of cube-root scaling at subkiloton yields: the energy needed to hydrodynamically excavate a unit volume of soil by hydrodynamic cratering action is a constant, so the energy required for hydrodynamic pulverization of crater mass m is E = mX where X is the number of Joules needed in cratering for the hydrodynamic excavation of 1 kg of soil.
But where the crater is deep in bigger explosions, the gravitational work energy E = mgh needed to eject crater mass m the vertical distance h upwards out of the hole to the lip, against gravitational acceleration g (9.8 ms-2)becomes larger than the hydrodynamic energy needed to merely break up the matter, so the gravity work effect then governs the crater scaling law. The total energy used in crater formation is the sum of two terms, hydrodynamic and gravitational: E = (mX) + (mgh).
The (mX)-term is proportional to the cube of the crater depth (because m is the product of volume and density, and volume is proportional to depth-cubed if the crater radius/depth ratio is constant), while the (mgh)-term is proportional to the fourth-power of the crater depth because m is proportional to the density times the depth cubed (if the depth/radius ratio is constant) and h is always directly proportional to the crater depth (h is roughly half the crater depth), so the product mgh is proportional to the product of depth cubed and depth, i.e., to the fourth-power of crater depth. So for bigger craters and bigger bomb yields, a larger fraction of the total cratering energy then gets used to overcome gravity, causing the gravity term to predominate and the crater size to scale at most by W1/4 at high yields. This makes the crater size scaling law transition from cube-root (W1/3) at low yields to fourth-root (W1/4) at higher yields!
It’s fascinating that, despite the best scientific brains working on nuclear weapons effects for many decades - the Manhattan Project focussed a large amount of effort on the problem, and utilised the top physicists who had developed quantum mechanics and nuclear physics, and people like Bethe were still writing secret papers on fireball effects into the 1960s - such fundamental physical effects were simply ignored for decades. This was due to the restricted number of people working on the problem due to secrecy, and maybe some kind of ‘groupthink’ (psychological peer-pressure): not to upset colleagues by ‘rocking the boat’ with too much freethinking, radical questions, innovative ideas.
The equation E = mgh isn't a speculative theory requiring nuclear tests to confirm it, it's a basic physical fact that can be experimentally proved in any physics laboratory: you can easily measure the energy needed to raise a mass (the amount of electric energy supplied to an electric motor while it winches up a standard 1 kg mass is a simple example of the kind of physical fact involved). In trying to analyse the effects of nuclear weapons, false approximations were sometimes used, which then became imbedded as a doctrine or faith about the ‘correct’ way to approach or analyze a particular problem. People, when questioned about a fundamental belief in such analysis, then are tempted respond dogmatically by simply referring to what the ‘consensus’ is, as if accepted dogmatic religious-style authority is somehow a substitute science, which is of course the unceasing need to keep asking probing questions, checking factual details for errors, omissions and misunderstandings, and forever searching for a deeper understanding of nature.
For example, in the case of a 10 Mt surface burst on dry soil, the 1957, 1962, and 1964 editions of Glasstone's Effects of Nuclear Weapons predicted a crater radius of 414 metres (the 10 Mt Mike test in 1952 had a radius of over twice that size, but that was due to the water-saturated porous coral of the island and surrounding reef, which is crushed very easily by the shock wave at high overpressures). This was reduced to 295 metres in Glasstone and Dolan, 1977, when the scaling law was changed from the cube-root to the 0.3 power of yield. The 1981 revision of Dolan's DNA-EM-1 brings it down to 145 metres, because of the tiny amount of energy which goes into the bomb case shock for a modern, efficient 10 Mt class thermonuclear warhead (Brode and Bjork discovered this bomb design effect on cratering in 1960; high-yield efficient weapons release over 80% of their yield as X-rays which are inefficient at cratering because they just cause ablation of the soil below the bomb, creating a shock wave and some compression, but far less cratering action than the dense bomb case shock wave produces in soil). Then in 1987, the introduction of gravity effects reduced the crater radius for a 10 Mt surface burst on dry soil to just 92 metres, only 22% of the figure believed up to 1964!
‘It is shown that the primary cause of cratering for such an explosion is not “airslap,” as previously suggested, but rather the direct action of the energetic bomb vapors. High-yield surface bursts are therefore less effective in cratering by that portion of the energy that escapes as radiation in the earliest phases of the explosion. [Hence the immense crater size from the 10 Mt liquid-deuterium Mike test in 1952 with its massive 82 ton steel casing shock is irrelevant to compact modern warheads which have lighter casings and are more efficient and produce smaller case shocks and thus smaller craters.]’ - H. L. Brode and R. L. Bjork, Cratering from a Megaton Surface Burst, RAND Corp., RM-2600, 1960.
‘Data on the coral craters are incorporated into empirical formulas used to predict the size and shape of nuclear craters. These formulas, we now believe, greatly overestimate surface burst effectiveness in typical continental geologies… coral is saturated, highly porous, and permeable ... When the coral is dry, it transmits shocks poorly. The crushing and collapse of its pores attenuate the shock rapidly with distance… Pores filled with water transmit the shock better than air-filled pores, so the shock travels with less attenuation and can damage large volumes of coral far from the source.’ – L.G. Margolin, et al., Computer Simulation of Nuclear Weapons Effects, Lawrence Livermore National Laboratory, UCRL-98438 Preprint, 25 March 1988, p. 5.
As L.G. Margolin states (above), improved understanding of crater data from the 1952-8 nuclear tests at Bikini and Eniwetok Atolls led to a reduction of predicted crater sizes from land bursts. The massive crater, 950 m in radius and 50 m under water (53 m deep as measured from the original bomb position), created by the 10.4 Mt Mike shot at Eniwetok in 1952, occurred in the wet coral reef surrounding an island because fragile water-saturated coral is pulverised to sand by shock wave pressure. Revised editions of the U.S. Department of Defence books The Effects of Nuclear Weapons and the classified manual Capabilities of Nuclear Weapons (secret) diminished the crater radius for a surface burst on dry soil:

In the 1957-64 editions, the crater radius was scaled by the well-proved TNT cratering ‘cube-root law’, W1/3, (which is now known to be valid where the work done by excavating against gravity is trivial in comparison to the work done in breaking up material). In the 1977 edition, the crater radius was scaled by less than the cube-root law, in fact the 0.3 power of yield, W0.3, in an effort to fit the American nuclear test data. Unfortunately, as shown in the following table, the American nuclear test data is too patchy for proper extrapolation to be made for dry soil surface bursts, because the one high yield (104-kt Sedan) Nevada explosive-type crater burst was buried at a depth of 194 m. This changes two sensitive variables at the same time, preventing reliable extrapolation.

*These bombs were at the bottom of the water tank, with 3 m of water above and around to increase the case-shock effect by X-ray absorption in water.
**650 kg device mass. The Cactus crater was in 1979 used to inter (under a concrete dome) some 84,100 m3 of contaminated topsoil and World War II munitions debris on Eniwetok Atoll in the American clean-up and decontamination work. The initial average height of the lip of this crater was 3.35 m.
During World War II, experiments showed that W kt of TNT detonated on dry soil produces a crater with a radius of 30W1/3 m. The radius of W kt of TNT is 5.4W1/3 m, or 18% of the dry soil crater radius. The crater is almost entirely due to the ‘case shock’ of a nuclear weapon, not the X-ray emission. This was discovered in the experiments with Koa and Seminole in water tanks to increase X-ray coupling to the ground (see table above). Nuclear weapons with yields below 2-kt (high mass to yield ratio, and low X-ray energy emission) which are surface burst produce craters similar to those from 23% of the TNT equivalent, while high-yield nuclear weapons (low mass to yield ratio, and high X-ray energy emission) which are surface burst produce craters similar to those from 2.9% of the TNT equivalent.

*These sizes apply to low yield-to-mass ratio nuclear warheads that incur a low X-ray energy emission. These produce the greatest craters, because most of the energy is initially in the case-shock of the bomb, rather than in X-rays (see below). These radii should be corrected for X-ray emission and total yield by the multiplying factor which can reasonably be taken to be 1.41(
fW )
1/3 (1 + 1.82
W1/4 )
-1/3, see below for derivation including gravitational effect at high yields. This factor is 1 for case-shock energy fraction
f and total yield
W kilotons both equal to 1. For pure fission warheads,
f = 1. For a 1-megaton modern thermonuclear warhead,
f = 1/8 because of the lower case-shock energy and higher proportional of energy in X-rays.
**These sizes apply to a different mechanism of cratering; namely the crushing of porous coral by the shock wave, so simple ‘cube-root’ scaling applies here.
About 72% of the energy entering the ground from a TNT explosion is used in cratering, while 28% is used in producing ground shock. The main ground shock from a surface burst nuclear explosion is derived from 7.5% of the total X-ray emission, which is absorbed by the ground within a radius of 3W1/3 m. The downward recoil of the ground in response to the explosive ablation of surface sand initiates a ground shock wave within a microsecond. The case shock of a nuclear weapon delivers 50% of its energy downward, which is all absorbed by the ground on account of its high density, and this is the principal crater mechanism. As debris is ejected from the crater in a cone shape, it absorbs some of the thermal radiation from the fireball within, and is melted, later becoming contaminated and being deposited as fallout. When nuclear weapons are detonated underground, the true TNT equivalent for a similar crater is 30% of the nuclear yield, because the X-rays cannot escape into the air, although a lot of energy is then wasted in melting and heating soil underground.
The long delay in nuclear effects people understanding crater scaling laws properly has an interesting history. Although Galileo identified craters on the moon using his telescope in 1609, it was only when a couple of astronauts from Apollo 14 visited an allegedly ‘volcanic lava crater’ (crater Fra Mauro) on the moon that they discovered the ejecta from a shallow explosion crater, without any volcanic lava. The idea of explosive cratering had been falsely discounted because physicists had observed very few craters on the earth and many on the moon. They had falsely assumed that the reason for this was strong volcanism on the moon, when it is really due to impact craters having been mostly eroded by geological processes on earth, and mostly preserved on the moon!
Early theoretical studies of crater formation, even using powerful computer simulations, employed explosion dynamics that ignored gravitation. Almost all of the books on the ‘effects of nuclear weapons’ in the public domain give nonsense for megaton surface bursts. It was only in 1986 that a full study of the effects of gravity in reducing crater sizes in the megaton range was performed: R. M. Schmidt, K. A. Holsapple, and K. R. Housen, ‘Gravity effects in cratering’, U.S. Department of Defense, Defense Nuclear Agency, report DNA-TR-86-182. In addition to secrecy issues on the details, the complexity of the unclassified portions of the new scaling procedures in this official treatment cover up the mechanisms, so here is a simple analytical explanation which is clearer:
If the energy used in cratering is E, the cratered mass M, and the explosive energy needed to physically break up a unit mass of the soil under consideration is X, then the old equation E = MX (which implies that crater volume is directly proportional to bomb yield and hence crater depth and diameter scale as the cube-root of yield) is completely false, as it omits gravitational work energy needed to shift soil from the crater to the surrounding ground.
This gravitational work energy is easy to estimate as ½ MgD, where M is the mass excavated, g is gravitational acceleration (9.8 m/s2 ), D is crater depth, and ½ is a rough approximation of the average proportionof the crater depth which displaced soil is vertically moved against gravity in forming the crater.
Hence the correct cratering energy not E = MX but rather E = MX + ½MgD. For yields well below 1-kt, the second term (on the right hand side) of this expression, ½ MgD, is insignificant compared to MX, so the volume excavated scales directly with yield, and since the volume is proportional to the cube of the average linear dimension, this means that the radius and depth both scale with the cube-root of yield for low yields.
But for very large yields, the second term, ½MgD, becomes more important, and this use of energy to overcome gravity in excavation limits the energy available for explosive digging, so the linear dimensions then scale as only the fourth-root (or quarter-power) of yield. Surface burst craters are paraboloid in shape, so they have a volume of: p R2 D/2 = (p /2)(R/D)2 D3, where the ratio of R/D is about 1.88 for a surface burst on dry soil. The mass of crater material is this volume multiplied by the density, r , of the soil material: M = rp(R/D)2 D3 /2.
Hence, the total cratering energy is: E = MX + ½ MgD = r (p /2)R2 D(X + ½gD).
The density of hard rock, soft rock and hard soil (for example granite, sandstone or basalt) is typically 2.65 kg/litre (2,650 kg per cubic metre), wet soil is around 2.10 kg/litre, water saturated coral reef is 2.02 kg/litre, typical dry soil is 1.70 kg/litre, Nevada desert is 1.60 kg/litre, lunar soil is 1.50 kg/litre (for analysis of the craters on the moon, where gravity is 6 times smaller than at the earth’s surface), and ice is 0.93 kg/litre.
The change over from cube-root to quarter-root scaling with increasing yield means that old crater size estimates (for example, those in the well-known 1977 book by Glasstone and Dolan, U.S. Department of Defence, 1977, The Effects of Nuclear Weapons) are far too big in the megaton range, and need to be multiplied by a correction factor.
The correction factor is easy to find. The purely explosive cratering energy efficiency, f, falls as gravity takes more energy, and is simply f = MX/(MX + ½MgD) = (1 + ½gD/X)-1.
Because gravity effects are small in the low and sub kiloton range, the correct crater radius for small explosions indeed scales hydrodynamically, as R ~ E1/3, so the 1-kt crater sizes in Glasstone and Dolan should be scaled by the correct factor R ~ W1/3(1 + ½ gD/X)-1/3 instead of by the empirical factor of R ~ W0.3 given by Glasstone and Dolan for Nevada explosion data of 1-100 kt. Glasstone and Dolan overestimates crater sizes by a large factor for megaton yield bursts. (The Americans had been mislead by data from coral craters, since coral is porous and is simply crushed to sand by the shock wave, instead of being excavated explosively like other media.
In megaton surface bursts on wet soft rock, the depth D increases only as W1/4, the ‘fourth root’ or ‘one-quarter power’ of yield scaling. Obviously for small craters, D scales as the cube-root of yield, but the correction factor (1 + ½ gD/X)-1/3 is only significant for the megaton range anyway, so a good approximation is to put D in this correction as proportional to the fourth-root of yield in this correction factor formula. The value of X for any soil material is a constant which may be easily calculated from the published crater sizes for a 1 kt surface burst, where gravity is not of importance (X is the cratered mass divided by the energy used in cratering, the latter being determined by an energy balance for the explosion effects).
The crater is made by two processes: the shock wave pulverisation of the soil (the energy required to do this is approximately proportional to the mass of soil pulverised) and the upward recoil of pulverised soil in reaction (by Newton’s 3rd law) to the downward push of the explosion (the energy required to do this excavation depends on gravitation, since it takes energy MgD to raise mass M a distance D upward against gravity acceleration g).
Russian near surface burst nuclear test cratering data (update of 13 May 2007):

The crater depth is defined as the final pit depth measured not from the top of the crater lip, but from the undisturbed surrounding ground. Likewise the crater radius is defined not as the radius to the top of the lip, but merely as the radius to in the undisturbed ground. For the Australian-British 1.5-kt
Buffalo-2 nuclear surface burst in dry soil at Maralinga in 1956, the crater lip height was 0.2
D where
D was crater depth, the radius of the crater lip crest was 1.25
R where
R was the crater radius, and the radius of the ground rupture zone was 1.4
R (these data are taken from U.K. test report AWRE-T37/57, 1957).
The following table contains crater data for three near surface bursts of low yield. These fission weapons, with yields of 0.5-1.5 kilotons, were all of low X-ray emission, which means they produced twice the crater radii and depth that would occur if they had the usual X-ray emission of large warheads (which is about 80%). The lower the X-ray emission, the greater is the energy retained by the bomb casing. The case shock has high density, so it ploughs itself deeply into the ground and efficiently delivers kinetic energy for crater formation (X-rays merely heat up the surface, and any physical push is created by the recoil from surface ablation, which is feeble for crater production, as is the recoil due to the reflection of the air blast wave).

These data when corrected for burst height to a true surface burst and corrected by the cube-root law to 1-kiloton yield (cube-root scaling is valid below 2-kt), suggest that for such low X-ray weapons, the crater size for a 1-kt surface burst on dry soil is R = 18.37 m, D = 9.784 m.
(Noted added 13 May 2007: attention should be given to including Russian nuclear test data for surface bursts - see table already given earlier in this post - in this analysis, to increase accuracy.)
It would be useful to have some exact figure showing how much energy is used to produce the crater in these tests. Careful measurements were made of blast and thermal radiation at surface bursts, and these give approximate figures. The blast wave and thermal radiation energy is reduced significantly in low-yield surface bursts. In the Australian-British nuclear tests at Maralinga in 1956 (Operation Buffalo), the first shot (a 15-kt tower burst which produced an insignificant crater effect) has a measured blast yield of 7.7-kt of TNT equivalent, or 51% of the total yield, but the second shot (a 1.5-kt surface burst which produced a deep crater) had a measured blast yield of 0.46-kt of TNT equivalent, or 31% of the total yield. The difference is smaller for higher yield detonations. Computer simulations of crater formation indicated that in the 0.50-kt 1962 Nevada surface burst, Johnnie Boy, some 30% of the total kinetic energy of the explosion must have been used in crater formation and ground shock, as compared to only 3.75% in megaton surface bursts. For comparison, 67% of the energy of an iron meteor, striking dry soil at 20 m/s and normal incidence (90 degrees), becomes ground shock and crater formation.
In the case of the 9 Mt missile warheads stockpiled in America to destroy Moscow’s bunkers in a nuclear war, in the mid 1980s it was suddenly realised that their cratering radius was only a small fraction of what had previously been believed. The political response by President Reagan officially was to cover this up, keeping news of it from leaking to Moscow, and to press on with arms reduction talks. The Soviet Union collapsed before they were aware of the impotence of American power for destroying the Soviet command centres in a nuclear war! (Soviet evaluation of nuclear test effects was even worse than American efforts! The Soviets could not even work out how to make a camera photograph the EMP on an oscilloscope without the dot saturating the film, which the Americans did by a circuit to keep the dot off-screen until just before detonation. Soviet 1962 ‘measurements’ of EMP thus relied on the distance sparks would jump, the rating of the fuses blown by current surges, and electric fires in power stations! As far as cratering goes, all of the Russian surface bursts were of kiloton-range yield, and not a single one had a megaton yield. At least America had some data for megaton shots on coral. The big Russian tests, up to 50 megatons, were air burst and produced no crater.)
Oleg Penkovskiy, the famed spy, in 1965 betrayed the Russian secret underground command centre in the Ural Mountain range to America, but that is built under tundra. With missile delivery times falling and the chance of a sudden war increasing, the Russians also had a World War II shelter under a location near Kuybishev, and there is a later one at Ramenki, but the leaders would not have time to reach such shelters from Moscow. So they then dug a very deep shelter with tunnels linked under the Kremlin in Moscow. When it was completed in 1982, the project manager (former general secretary Chernenko) was awarded the Lenin Prize! The shelter is 200-300 metres underground with the well protected floors at the lowest levels and accommodates up to 10,000 key personnel. A 9-megaton surface burst causes severe underground destruction at 1.5 crater radii; for the ‘wet soft rock’ geological environment of the Moscow basin, this is 1.5 x 120 = 180 metres. You can see the problem! Even the biggest American warheads, 9-megatons, carried by the tremendous Titan missiles, could not seriously threaten Russian leadership in a war, because the Russian shelters were then simply too deep. Nuclear horror tales are just bunk. The duration and penetrating power of the heat flash and fallout radiation are also media-exaggerated.
Severe damage to missile silos occurs at 1.25 crater radii (rupture); severe damage to underground shelters occurs at 1.5 crater radii (collapse)
The effects from nuclear weapons that are ‘scary’ – in that they cover the widest areas –
are all easily mitigated effects, like flying glass (don’t watch the fireball from behind a window), heat flash (again, look away, or better, ‘duck and cover’ under a table or just lie face down facing away to avert burns to exposed face and hands as well as glass fragments; dark clothes take time to ignite and someone lying down can put out any ignition after the flash simply by rolling over), and fallout (intense fission product radiation is due to fast decay, so it doesn’t last long, the mixture decays faster than 1/time, and at 2 days it is on average just 1% of the level at 1 hour; most of it is stopped by brick buildings). As the secret photos of fallout covered trays from the 3.53 megaton 1956 Zuni test at Bikini Atoll show (see Dr Terry Triffet and Philip D. LaRiviere,
Characterisation of Fallout, WT-1317, 1961, for long classified ‘Secret – Restricted Data’, but now available), the fallout in a significant danger areas is clearly visible deposit of fused sand and not a mysterious death ray gas, you get hundreds of sand-like grains per square centimetre in lethal fallout areas where cover is necessary, but it is not so heavy that you’ll see the Statue of Liberty half covered by fallout, as in ‘Planet of the Apes’. It is true that a thunderstorm after an air burst can produce rainout, but that just
goes down the drain, carrying the tiny air burst particles with it, and drains are deep enough to shield the gamma radiation! Triffet and LaRiviere also point out that a dirty bomb with U-238 in its casing produces a lot of Np-239 and related neutron capture products which predominate over most fission products for a week or two, but emit very easily shielded, low-energy gamma rays. Therefore you don’t need sophisticated shelters to screen most of the radiation. The sand-like fallout doesn’t diffuse like a gas, either. G. G. Stokes found that for a spherical particle of radius
r moving at speed
v through air of viscosity
m , the drag force is
F = 6
pmrv, which allows the fallout times to be calculated.
The ‘Force of sound’
The sound wave is longitudinal and has pressure variations. Half a cycle is compression (overpressure) and the other half cycle of a sound wave is underpressure (below ambient pressure). When a spherical sound wave goes outward, it exerts outward pressure which pushes on you eardrum to make the noises you hear. Therefore the sound wave has outward force F = PA where P is the sound wave pressure and A is the area it acts on. When you read Raleigh’s textbook on ‘sound physics’ (or whatever dubious title it has), you see the fool fits a wave equation from transverse water waves to longitudinal waves, without noting that he is creating particle-wave duality by using a wave equation to describe the gross behaviour of air molecules (particles). Classical physics thus has even more wrong with it becauss of mathematical fudges than modern physics, but the point I’m making here is that sound has an outward force and an equal and opposite inward force following this. It is this oscillation which allows the sound wave to propagate instead of just dispersing like air blown out of your mouth.
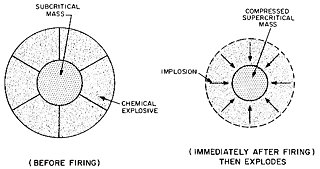
Note the outward force and equal and opposite inward force. This is Newton’s 3rd law. The same happens in explosions, except the outward force is then a short tall spike (due to air piling up against the discontinuity and going supersonic), while the inward force is a longer but lower pressure. A nuclear implosion bomb relies upon Newton’s 3rd law for TNT surrounding a plutonium core to compress the plutonium. The same effect in the Higgs field surrounding outward going quarks produces an inward force which gives gravity, including the compression of the earth's radius (1/3)MG/c2 = 1.5 mm (the contraction term effect in general relativity).
Why not fit a wave equation to the group behaviour of particles (molecules in air) and talk sound waves? Far easier than dealing with the fact that the sound wave has an outward pressure phase followed by an equal under-pressure phase, giving an outward force and equal-and-opposite inward reaction which allows music to propagate. Nobody hears any music, so why should they worry about the physics? Certainly they can't hear any explosions where the outward force has an equal and opposite reaction, too, which in the case of the big bang tells us gravity.
Thanks for this post! It always amazes me to see how waves interact. You'd intuitively expect two waves colliding to destroy each other, but instead they add together briefly while they superimpose, then emerge from the interaction as if nothing has happened.
Dr Dave S. Walton tried it with logical signals (TEM - trabsverse electromagnetic) waves carried by a power transmission line like a piece of flex. Logic signals were sent in opposite directions through the same transmission line.
They behaved just like water surface waves. What's interesting is that when they overlapped, there was no electric drift current because there was (during the overlap) no gradient of electric field to cause electrons to drift. As a result, the average resistance decreased! (Resistance only occurs when you are having to do work by accelerating electrons against resistance from collisions with atoms.)
Another example is the reflection of a weak shock wave when it hits a surface. The reflected pressure is double the incident pressure, because the leading edge of the shock wave collides with itself at the instant it begins to reflect, at doubling the pressure like the superposition of two similar waves travelling in opposite directions as they pass through one another. With strong shock waves, you get more than a doubling of pressure because there is significant dynamic or wind pressure in strong shocks (q = 0.5*Rho*u^2 where Rho is density and u is the particle velocity in the shock wave) and this gets stopped by a reflecting surface, and the energy is converted into additional reflected overpressure.