Friday, March 31, 2006

Starfish fireball photograph


Above: seen from a mountain high above the cloud cover on Maui, the luminous STARFISH (1.4 Mt, 400 km, 9 July 1962) debris fireball expands in space with an initial speed of 2,000 km/sec, and has a massive vertical asymmetry due to the effects of the device and missile system.


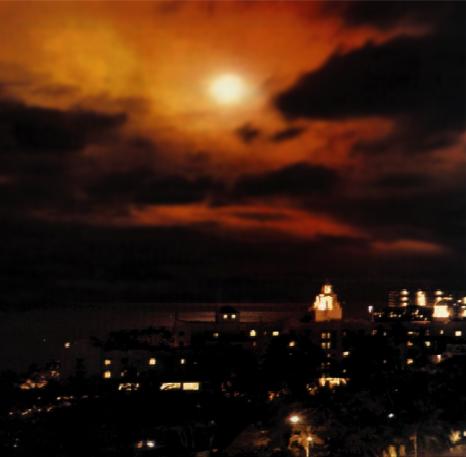
Above: Starfish as seen through heavy clouds from Honolulu, Oahu, Hawaiian islands, just over 1,300 km from the 1.4 Mt detonation at 400 km altitude; for the measured EMP waveforms from this and other tests see an earlier post. For a sumary of visible and thermal effects of all the tests see another earlier post. Below: Starfish fireball (together with ionised region below burst as seen looking upward through the atmosphere from a KC-135 aircraft flying above the clouds).

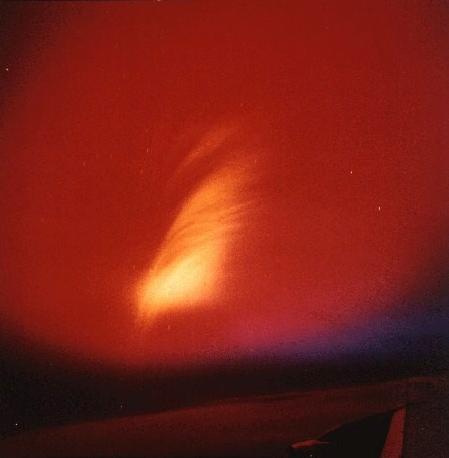
The picture above of the Starfish fireball is wrongly identified as just an aurora in some places on the internet. However, it is actually the debris fireball seen 3 minutes after detonation. There is air fluorescence from the atmosphere between the observer and the detonation (it is just an illusion that the glowing air appears above the fireball as well as below it, you have to remember that a large pancake shaped layer of glowing air below the fireball extends over the observer's field of view), which is excited by magnetic field-aligned radioactive fireball debris:


Above: this is the LA-6405 scientific analysis of the previous Starfish fireball photograph, showing how the fireball debris has become striated by the earth's magnetic field at 3 minutes. The debris, being ionised and thus electrically conductive, has to do more work to expand against the magnetic field (lines) than along them, so it expands preferentially along the magnetic field. However, some portion of the fireball energy is always used up expanding against the magnetic field, and this obviously creates the weak but lengthy late-time magneto-hydrodynamic (MHD) EMP discussed already. For more on the Starfish test, see the declassified preliminary report dated August 1962 online here, also DASA-1925 dated 1967 (declassified version online here), and a 1978 online report on the effects of Starfish on orbital satellites in 1962.

Credit: This illustration is taken from page 8 of Dr Herman Hoerlin's report, United States High Altitude Test Experiences, Los Alamos National Laboratory, LA-6405, 1976.

The Starfish test filmed from Johnston Island with a camera pointing upwards showed the outer debris fireball to be expanding at an initial rate of 2,000 km/second, and the debris had: 'separated into two parts ... the central core which expands rather slowly and ... an outer spherically expanding shell ... The diameter of the expanding shell is approximately 2 km at 500 microseconds ...' (AD-A955411, A 'Quick Look' at the Technical Results of Starfish Prime, August 1962.)

Within 0.04-0.1 second after burst, the outer shell - as filmed from Maui in the Hawaiian Islands (Oahu was 1,353 km from ground zero), had become elongated along the earth's magnetic field, creating an ellipsoid-shaped fireball. Visible 'jetting' of radiation up and southward was observed from the debris fireball at 20-50 seconds, and some of these jets are visible in the late time photograph of the debris fireball shown above.

‘Recently analyzed beta particle and magnetic field measurements obtained from five instrumented rocket payloads located around the 1962 Starfish nuclear burst are used to describe the diamagnetic cavity produced in the geomagnetic field. Three of the payloads were located in the cavity during its expansion and collapse, one payload was below, and the fifth was above the fully expanded cavity. This multipoint data set shows that the cavity expanded into an elongated shape 1,840 km along the magnetic field lines and 680 km vertically across in 1.2 s and required an unexpectedly long time of about 16 s to collapse. The beta flux contained inside the cavity was measured to be relatively uniform throughout and remained at 3 × 10¹¹ beta particles/cm2 s for at least 7 s. The plasma continued to expand upward beyond the fully expanded cavity boundary and injected a flux measuring 2.5 × 10¹⁰ beta particles/cm2 s at H + 34 s into the most intense region of the artificial belt. Measured 10 hours later by the Injun I spacecraft, this flux was determined to be 1 × 10⁹ beta particles/cm2 s.’ - Palmer Dyal, ‘Particle and field measurements of the Starfish diamagnetic cavity’, Journal of Geophysical Research, volume 111, issue A12, page 211 (2006).

Palmer Dyal was the nuclear test Project Officer and co-author with W. Simmons of Operation DOMINIC, FISH BOWL Series, Project 6.7, Debris Expansion Experiment, U.S. Air Force Weapons Laboratory, Kirkland Air Force Base, New Mexico, POR-2026 (WT-2026), AD-A995428, December 1965:

'This experiment was designed to measure the interaction of expanding nuclear weapon debris with the ion-loaded geomagnetic field. Five rockets on STARFISH and two rockets on CHECKMATE were used to position instrumented payloads at various distances around the burst points. The instruments measured the magnetic field, ion flux, beta flux, gamma flux, and the neutron flux as a function of time and space around the detonations. Data was transmitted at both real and recorded times to island receiving sites near the burst regions. Measurements of the telemetry signal strengths at these sites allowed observations of blackout at 250 MHz ... the early expansion of the STARFISH debris probably took the form of an ellipsoid with its major axis oriented along the earth's magnetic field lines. Collapse of the magnetic bubble was complete in approximately 16 seconds, and part of the fission fragment beta particles were subsequently injected into trapped orbits. ...

‘At altitudes above 200 kilometres ... the particles travel unimpeded for several thousands of kilometres. During the early phase of a high-altitude explosion, a large percentage of the detonation products is ionized and can therefore interact with the geomagnetic field and can also undergo Coulomb scattering with the ambient air atoms. If the expansion is high enough above the atmosphere, an Argus shell of electrons can be formed as in the 1958 and 1962 test series. ... If this velocity of the plasma is greater than the local sound or Alfven speed, a magnetic shock similar to a hydro shock can be formed which dissipates a sizable fraction of the plasma kinetic energy. The Alfven velocity is C = B/(4*{Pi}*{Ion density, in ions per cubic metre})1/2, where ... B is the magnetic field ... Since the STARFISH debris expansion was predicted and measured to be approximately 2 x 108 cm/sec and the Alfven velocity is about 2 x 107 cm/sec, a shock should be formed. A consideration of the conservation of momentum and energy indicates that the total extent of the plasma expansion proceeds until the weapon plasma kinetic energy is balanced by the B2/(8{Pi}) magnetic field energy [density] in the excluded region and the energy of the air molecules picked up by the expanding debris. ... An estimate of the maximum radial extent of the STARFISH magnetic bubble can be made assuming conservation of momentum and energy. The magnetic field swept along by the plasma electrons will pick up ambient air ions as it proceeds outward. ...’

Conservation of momentum suggests that the initial outward bomb momentum, MBOMBVBOMB must be equal to the momentum of the total expanding fireball after it has picked up air ions of mass MAIR IONS:

MBOMBVBOMB = (MBOMB + MAIR IONS)V,

where V is the velocity of the combined shell of bomb and air ions. The expansion of the ionized material against the earth’s magnetic field slows it down, so that the maximum radial extent occurs when the initial kinetic energy E = (1/2) MBOMBVBOMB2 has been converted into the potential energy density of the magnetic field which stops its expansion. The energy of the magnetic field excluded from the ionized shell of radius R is simply the volume of that shell multiplied by the magnetic field energy density B2/(8{Pi}). By setting the energy of the magnetic field bubble equal to the kinetic energy of the explosion, the maximum size of the bubble could be calculated, assuming the debris was 100% ionized.

For CHECKMATE, they reported: ‘Expansion of the debris was mostly determined by the surrounding atmosphere which had a density of 4.8 x 10¹⁰ particles/cm3. Further details of high altitude bursts are discussed here.

The report AD-A955411, A 'Quick Look' at the Technical Results of Starfish Prime, August 1962, states that the test was planned for 400 km altitude to test a theory that an ionised 'pancake' of air would be caused 80 km over ground zero as a 'precursor shot' to block enemy ABM radar from accurately plotting the paths of subsequent ICBM's over the target area.

This prediction failed completely, because the major beta ray and bomb debris pancake occurred not over ground zero, but 600 km north of ground zero due to the charged radiations following the magnetic field lines as they descended. The altitude of this main pancake of ionised air was 120-150 km, not 80 km. Because the slope of the Earth's magnetic field lines over Johnston Island were about 28 degrees off horizontal, the beta pancake should have been predicted to be: (height of burst - height of pancake)/(sin 28 degrees) ~ 600 km.

It shows the poor level of physical understanding existing in 1962, because this was not predicted (they had apparently just tried to extrapolate from observations of the Teak test in 1958 which was at only 77 km altitude). Anyway, the pancake 600 km north of ground zero began to form at 70 milliseconds after the Starfish test. The magnetic field line running through the burst at 28 degrees [reference: R.A. Berg et al., A Starfish Happening, Lockheed Missiles and Space Co., March 1967, DASA-1925, AD-A955681, c2, p22] off vertical reached an altitude of 900 km above the magnetic equator and it also carried some beta radiation and debris initially upward to the south, where it followed the magnetic field line to its maximum and then back down into the atmosphere, creating the aurora seen from Tongatapu.

The Atomic Weapons Establishment has a page with labelled colour photos of all American tests, and another page which explains this MHD-EMP mechanism:

'Bursts below around 100km altitude produce relatively well defined fireball regions which rise and expand rapidly, examples being the Orange and Bluegill events.

'Detonations at higher altitudes [100-200 km] are in the "UV (ultraviolet radiation) fireball" regime; the debris blast wave expands and sweeps up air which becomes very hot. This then radiates UV, which is readily absorbed by the cold air in front of the blast wave, resulting in ionised air which is approximately transparent to further UV radiation from the blast wave. These bursts are therefore characterised by two "fireballs" - the debris air blast wave expansion is preceded by a radiation/ionisation front. The radiation front will be up/down asymmetric since mean free paths are longer in the less dense airabove the detonation altitude. An example is the Checkmate event where both fronts are clearly visible in the photograph taken from Johnston Island [for large time-labelled Checkmate film stills, see here and here]:


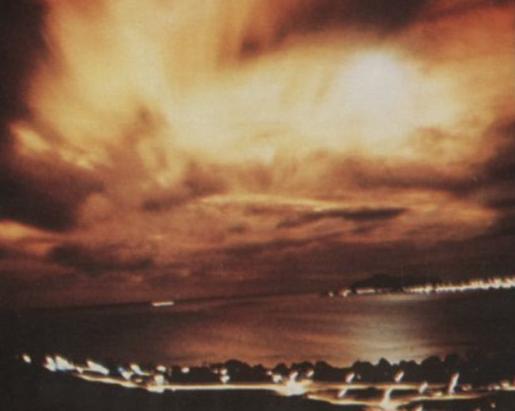
Above: CHECKMATE detonation horizontal view (seen from a distant aircraft) compared to the view looking upwards from Johnston Island. It was detonated during the Cuban missiles crisis: 'Observers on Johnston Island saw a green and blue circular region surrounded by a blood-red ring formed overhead that faded in less than 1 minute. Blue-green streamers and numerous pink striations formed, the latter lasting for 30 minutes. Observers at Samos saw a white flash, which faded to orange and disappeared in about 1 minute.' (Defense Nuclear Agency report DNA-6040F, AD-A136820, p. 241.)

'Detonations above the [100-200 km burst altitude] UV fireball regime are characterised by so-called "patch deposition"; the expanding debris compresses the geomagnetic field lines because the expansion velocity is greater than the Alfven speed at these altitudes. The debris energy is transferred to air ions in the resulting region of tightly compressed magnetic field lines. Subsequently the ions, charge-exchanged neutrals, beta-particles etc escape up and down the field lines. Those particles directed downwards are deposited in patches at altitudes depending on their mean free paths. These particles move along the magnetic field lines, and so the patches are not found directly above ground zero. Uncharged radiation (gamma-rays, neutrons and X-rays) is deposited in layers which are centered directly under the detonation point. The Starfish event (1.4 megatons at 400 km) was in this altitude regime:


'Detonations at thousands of kilometres altitude are contained purely magnetically. Expansion is at less than the local Alfven speed, and so energy is radiated as hydromagnetic waves. Patch depositions are again aligned with the field lines.' - Atomic Weapons Establishment internet page, Schematic summaries of some of the principal physics phenomena.


Above: 'Geomagnetically trapped MeV beta-particles generated by a high altitude nuclear burst can pose a serious threat to space-based systems, especially satellites.

'The particles may be trapped in the magnetosphere because the geomagnetic field strength is nonuniform (the field is approximately dipolar, therefore decreasing away from the Earth's surface); particles moving along a field line towards Earth will experience a retarding force due to simultaneous conservation of their magnetic moment and energy, which may eventually lead to "reflection". Such a magnetic field configuration is termed a "magnetic mirror".

'Early experiments in controlled thermonuclear fusion physics were carried out on "mirror machines" which were magnetic bottles based on the same principal. Beta-particles trapped in the geomagnetic field may bounce back and forth along the magnetospheric field lines, never reaching the dense atmosphere below. The radiation is not confined to the injection longitude, but spreads around the Earth due to the magnetic field gradient and curvature drifts which are well known in plasma particle kinetics. This is exactly analagous to the mechanism trapping natural Van-Allen belt radiation, the differences lying only in the charged particle injection mechanism and their typical energies.

'A Monte-Carlo model has been developed to predict the space radiation flux following a high altitude nuclear explosion. The following images show sample code outputs; the first three figures are views from above the North pole of the Earth (represented as a circle). The progress of radiation around the Earth over several minutes is apparent in the contour plots. [The accompanying illustration is labelled for debris radius of 500 km and a burst at 399 km - the precise burst altitude of Starfish - and shows the electron belt stretching a third of the way around the Earth's equator after 3 minutes, and completely surrounding the earth at 10 minutes after burst. The averaged beta particle radiation flux in the belt is about 2 x 10¹⁴ electrons per square metre per second at 3 minutes after burst but falls to a quarter of that at 10 minutes.]

'... the level will eventually drop off since some particles are confined to reflect close to the equator, never reaching high latitudes. Also the atmosphere effectively mops up particles that reflect below an altitude where the air density becomes appreciable. The radiation belt evolves with time, taking between days and months to return to the ambient state as particles are gradually scattered by atmospheric and magnetospheric effects.' - Atomic Weapons Establishment, Nuclear Effects Group - Artificial Radiation Belt Modelling

The Atomics Weapons Establishment also has a time-motion film of the Monte Carlo simulation of the evolution and decay of the radiation belt from Starfish here. This remarkable film is logarithmically scaled so you get to see the way the intensities vary above the Earth's surface from 100 seconds to nearly 100 years after the burst. As the time goes on, the radiation belt pushes up to higher altitudes and becomes more concentrated over the magnetic equator.

For the first 5 minutes, the Starfish radiation belt has an altitude range of about 200-400 km and reaches from 27 degrees south of the magnetic equator to 27 degrees north of it. At 1 day after burst, the radiation belt height has increased to the 600-1,100 km zone, and the average flux is 1.5 x 10¹² electrons/m2/sec. At 4 months the altitude for this average flux (plus or minus a factor of 4) has increased to 1,100-1,500 km, and it is covering a smaller latitude range around the magnetic equator, from about 20 degrees north to about 20 degrees south. At 95 years after burst, the remaining electrons will be concentrated 2,000 km above the magnetic equator in a shell only 50 km thick, covering a latitude range of only plus or minus 10 degrees from the equator.

Glasstone and Dolan explain how test data showed these effects in The Effects of Nuclear Weapons 1977, pp. 45 et seq.: 'The geomagnetic field exerts forces on charged particles, i.e., beta particles (electrons) and debris ions, so that these particles are constrained to travel in helical (spiral) paths along the field lines. Since the earth behaves like a magnetic dipole, and has north and south poles, the field lines reach the earth at two points, called "conjugate points," one north of the magnetic equator and the other south of it. Hence, the charged particles spiraling about the geomagnetic field lines will enter the atmosphere in corresponding conjugate regions. It is in these regions that the auroras may be expected to form.

'For the high-altitude tests conducted in 1958 and 1962 in the vicinity of Johnston Island, the charged particles entered the atmosphere in the northern hemisphere between Johnston Island and the main Hawaiian Islands, whereas the conjugate region in the southern hemisphere region was in the vicinity of the Samoan, Fiji, and Tonga Islands. It is in these areas that auroras were actually observed, in addition to those in the areas of the nuclear explosions.

'Because the beta particles have high velocities, the beta auroras in the remote (southern) hemisphere appeared within a fraction of a second of those in the hemisphere where the bursts had occurred. The debris ions, however, travel more slowly and so the debris aurora in the remote hemisphere, if it is formed, appears at a somewhat later time. The beta auroras are generally most intense at an altitude of 30 to 60 miles, whereas the intensity of the debris auroras is greatest in the 60 to 125 miles range. Remote conjugate beta auroras can occur if the detonation is above 25 miles, whereas debris auroras appear only if the detonation altitude is in excess of some 200 miles.

'For bursts at sufficiently high altitudes, the debris ions, moving along the earth's magnetic field lines, are mostly brought to rest at altitudes of about 70 miles near the conjugate points. There they continue to decay and so act as a stationary source of beta particles which spiral about the geomagnetic lines of force. When the particles enter a region where the strength of the earth's magnetic field increases significantly, as it does in the vicinity of the conjugate points, some of the beta particles are turned back (or reflected). Consequently, they may travel back and forth, from one conjugate region to the other, a number of times before they are eventually captured in the atmosphere.

'In addition to the motion of the charged particles along the field lines, there is a tendency for them to move across the lines wherever the magnetic field strength is not uniform. This results in an eastward (longitudinal) drift around the earth superimposed on the back-and-forth spiral motion between regions near the conjugate points. Within a few hours after a high-altitude nuclear detonation, the beta particles form a shell completely around the earth. In the Argus experiment, in which the bursts occurred at altitudes of 125 to 300 miles, well-defined shells of about 60 miles thickness, with measurable electron densities, were established and remained for several days. This has become known as the "Argus effect." Similar phenomena were observed after the Starfish Prime and other high-altitude nuclear explosions.'

We have already seen in a previous post that Dr Herman Hoerlin writes in Los Alamos National Laboratory report LA-6405, United States High Altitude Test Experiences, p. 1:

'The degrading effects of increased ionospheric ionization on commercial and aircraft communications-mainly in the LF, MF, and HF frequency ranges—extended over the whole Pacific Ocean area. They lasted for many days after the three megaton-range [high altitude] explosions [Teak, Orange, and Starfish]. They were less severe—in some cases even beneficial-for VHF and VLF frequencies, thus providing guidance for emergency situations.

'The formation of an artificial radiation belt of such high electron fluxes and long lifetimes as occurred after the Starfish event was unexpected; so were the damages sustained by three satellites in orbit [the Ariel, Traac, and Transit 4B satellites failed; Cosmos V, Injun I and Telstar suffered only minor degradation, moderate solar cell damage by electrons].

'However, the vast amount of knowledge gained by the observations of the artificial belts generated by Starfish, Argus, and the Russian high-altitude explosions [notice that America had data on the Russian tests back in 1976, when this report was written] far outweighed the information which would have been gained otherwise. A few extrapolations are made to effects on manned space flight under hypothetical circumstances...'

Page 26 states: 'for a satellite in a polar circular earth orbit, the daily dose would have been at the very least 60 rads in a heavily shielded vehicle at Starfish time plus four months'.

Judging by the Atomic Weapons Establishment computer simulation discussed above, at 4 months after Starfish this radiation, the radiation belt was at 1,100-1,500 km altitude, and it covered a latitude range around the magnetic equator, from 20 degrees north to 20 degrees south. Because NASA launches rockets from near the equator to gain the speed of earth's spin, they would be exposed to to this radiation. Obviously a space rocket going to the moon will only spend seconds in the radiation belt, and at a 60 rads/day this will be trivial, but astronauts in capsules in low earth orbits, where the spacecraft remained in the radiation belts for a long time, would receive more substantial doses of radiation. I'll discuss this subject of radiation in space in a later post. There's a lot more cosmic radiation on the moon than on earth, for instance, because there is no atmosphere. The earth's atmosphere has the same mass cover shielding as being behind 10 metres of water. Radiation is a general hazard in outer space.

Click here for the DTRA (U.S. Defence Threat Reduction Agency) presentation of the effects of space burst radiation belts on low earth orbit satellites. Another report on the same topic, by Dennis Papadopoulos of the University of Maryland, is available by clicking here.


EMP is extensively discussed here, here, here, and here. E.g.:

In December 1992, the U.S. Defence Nuclear Agency spent $288,500 on contracting 200 Russian scientists to produce a 17-chapter analysis of effects from the Soviet Union’s nuclear tests, which included vital data on three underwater nuclear tests in the arctic, as well three 300 kt high altitude tests at altitudes of 59-290 km over Kazakhstan. In February 1995, two of the military scientists, from the Russian Central Institute of Physics and Technology, lectured on the electromagnetic effects of nuclear tests at Lawrence Livermore National Laboratory. The Soviet Union had first suffered electromagnetic pulse (EMP) damage to electronic blast instruments in their 1949 test. Their practical understanding of EMP damage eventually led them, on Monday 22 October 1962, to detonate a 300 kt missile-carried thermonuclear warhead at an altitude of 300 km (USSR test 184). That was at the very height of the Cold War and the test was detected by America: at 7 pm that day, President John F. Kennedy, in a live TV broadcast, warned the Soviet Union’s Premier Khrushchev of nuclear war if a nuclear missile was launched against the West, even by an accident: ‘It shall be the policy of this nation to regard any nuclear missile launched from Cuba against any nation in the Western hemisphere as an attack by the Soviet Union on the United States, requiring a full retalitory response upon the Soviet Union.’ That Russian space missile nuclear test during the Cuban missiles crisis deliberately instrumented the civilian power infrastructure of populated areas, unwarned, in Kazakhstan to assess EMP effects on a 570 km long civilian telephone line and a 1,000 km civilian electric power cable! This test produced the worst effects of EMP ever witnessed (the more widely hyped 1.4 Mt, 400 km burst STARFISH EMP effects were trivial by comparison, because of the weaker natural magnetic field strength at Johnston Island). The bomb released 1025 MeV of prompt gamma rays (0.13% of the bomb yield). The 550 km East-West telephone line was 7.5 m above the ground, with amplifiers every 60 km. All of its fuses were blown by the induced peak current, which reached 2-3 kA at 30 microseconds, as indicated by the triggering of gas discharge tubes. Amplifiers were damaged, and lightning spark gaps showed that the potential difference reached 350 kV. The 1,000 km long Aqmola-Almaty power line was a lead-shielded cable protected against mechanical damage by spiral-wound steel tape, and buried at a depth of 90 cm in ground of conductivity 10-3 S/m. It survived for 10 seconds, because the ground attenuated the high frequency field, However, it succumbed completely to the low frequency EMP at 10-90 seconds after the test, since the low frequencies penetrated through 90 cm of earth, inducing an almost direct current in the cable, that overheated and set the power supply on fire at Karaganda, destroying it. Cable circuit breakers were only activated when the current finally exceeded the design limit by 30%. This limit was designed for a brief lightning-induced pulse, not for DC lasting 10-90 seconds. By the time they finally tripped, at a 30% excess, a vast amount of DC energy had been transmitted. This overheated the transformers, which are vulnerable to short-circuit by DC. Two later 300 kt Soviet Union space tests, with similar yield but low altitudes down to 59 km, produced EMPs which damaged military generators.

Thursday, March 30, 2006

Fires from nuclear explosions


Above: film of the Effects of Nuclear Weapons.

Hiroshima: it was not 'vaporised by 6,000 °C within an instant': all the wood-frame buildings burned down in a firestorm that developed 30 minutes later, as a result of the blast knocking over cooking braziers amid paper screens and bamboo furniture. (Hiroshima was attacked at breakfast time, Nagasaki at lunch time.) The modern buildings tended to survive better as shown, simply because brick and concrete are obviously not inflammable. They also gave better protection against radiation and blast. People live in both cities today. Fewer than 1% of victims died due to cancer caused by radiation. The maximum leukemia rate occurred in 1952 and ever since has been declining. There were no genetic effects above the normal rate in offspring of even highly irradiated survivors and cancer risks were carefully studied:

'The Life Span Study (LSS) population consists of about 120,000 persons who were selected on the basis of data from the 1950 Japanese National Census. This population includes ... atomic-bomb survivors living in Hiroshima or Nagasaki and nonexposed controls. ... all persons in the Master Sample who were located less than 2,500 meters from the hypocenter ATB were included in the LSS sample, with about 28,000 persons exposed at less than 2,000 meters serving as the core. Equal numbers of persons who had been located 2,500-9,999 meters from hypocenter ... were selected to match the core group by age and sex. ... As of 1995, more than 50% of LSS cohort members are still alive. As of the end of 1990, almost 38,000 deaths have occurred in this group, including about 8,000 cancer deaths among the 87,000 survivors. Approximately 430 of these cancer deaths are estimated to be attributable to radiation.'

Nuclear tests were later conducted in 1953 and 1955 to see if white-washing wooden houses would reflect the heat flash and prevent ignition: it worked! Various types of full scale houses were exposed on March 17, 1953 to 16-kiloton Annie and on May 5, 1955 to 29-kiloton Apple-2 in Nevada. The front of the houses was charred during the intense radiant heat flash, but none of them ignited even where the blast was severe enough to physically demolish the house. Fences and huts exposed at the 1953 test had to be covered in rubbish to ignite: see this film.

Even ignoring the problems of starting a fire in a modern building after the EMP has taken out mains electricity, firestorms are also impossible in most cities, judging by the criteria required for firestorms when the R.A.F. and U.S.A.F. tried very hard with thousands of tons of incendiaries over limited areas in World War II. Some experts were aware of this fact as early as 1979:

‘Some believe that firestorms in U.S. or Soviet cities are unlikely because the density of flammable materials (‘fuel loading’) is too low–the ignition of a firestorm is thought to require a fuel loading of at least 8 lbs/ft2 (Hamburg had 32), compared to fuel loading of 2 lbs/ft2 in a typical U.S. suburb and 5 lbs/ft2 in a neighborhood of two story brick row-houses, communications and electric power systems of the victim.’ – U.S. Congress, Office of Technology Assessment, The Effects of Nuclear War, May 1979, page 22.

See also the report by Drs. Kenneth A. Lucas, Jane M. Orient, Arthur Robinson, Howard MacCabee, Paul Morris, Gerald Looney, and Max Klinghoffer, ‘Efficacy of Bomb Shelters: With Lessons From the Hamburg Firestorm’, Southern Medical Journal, vol. 83 (1990), No. 7, pp. 812-20:

‘Others who have recently tried to develop criteria for the development of a firestorm state that the requisite fuel loading appears to be about four times the value of 8 lb/sq ft cited earlier. ... A standard Soviet civil defense textbook states: "Fires do not occur in zones of complete destruction [overpressure greater than 7 psi]; flames due to thermal radiation are prevented, because rubble is scattered and covers the burning structures. As a result the rubble only smolders."’

The then-‘secret’ May 1947 U.S. Strategic Bombing Survey report on Nagasaki states (v. 1, p. 10): ‘… the raid alarm was not given ... until 7 minutes after the atomic bomb had exploded ... less than 400 persons were in the tunnel shelters which had capacities totalling approximately 70,000.’ This situation, of most people watching lone B-29 bombers, led to the severe burns by radiation and flying debris injuries in Hiroshima and Nagasaki. The May 1947 U.S. Strategic Bombing Survey report on Hiroshima, pp 4-6:

‘Six persons who had been in reinforced-concrete buildings within 3,200 feet [975 m] of air zero stated that black cotton black-out curtains were ignited by flash heat... A large proportion of over 1,000 persons questioned was, however, in agreement that a great majority of the original fires were started by debris falling on kitchen charcoal fires... There had been practically no rain in the city for about 3 weeks. The velocity of the wind ... was not more than 5 miles [8 km] per hour….

‘The fire wind, which blew always toward the burning area, reached a maximum velocity of 30 to 40 miles [48-64 km] per hour 2 to 3 hours after the explosion ... Hundreds of fires were reported to have started in the centre of the city within 10 minutes after the explosion... almost no effort was made to fight this conflagration within the outer perimeter which finally encompassed 4.4 square miles [11 square km]. Most of the fire had burned itself out or had been extinguished on the fringe by early evening ... There were no automatic sprinkler systems in building...’

Dr Ashley Oughterson and Dr Shields Warren noted a fire risk in Medical Effects of the Atomic Bomb in Japan (McGraw-Hill, New York, 1956, p. 17):

‘Conditions in Hiroshima were ideal for a conflagration. Thousands of wooden dwellings and shops were crowded together along narrow streets and were filled with combustible material.’

Dr Harold L. Brode and others have investigated the physics of firestorms in commendable depth, see for example, this 1986 report, The Physics of Large Urban Fires: http://fermat.nap.edu/books/0309036925/html/73.html

That lists the history of firestorms, and gives some very interesting empirical and semiempirical formulae. It contains computer simulations of firestorms which show the way Hiroshima and Hamburg must have burned, and these simulations might well apply to forests in the fall (with little green leaves to shield the ground, and lots of dry leaves and branches on the ground to act as kindling, like the litter used to start fence and house fires in the 1953 Nevada nuclear tests). However, modern cities would tend to be left smouldering rubble. Dresden and Hamburg had medieval multistorey wooden buildings in the areas that burned, and people don't build cities like they used to!

The best equation in that 1986 report is Brode's formula for the thermal radiating power versus time curve of a low altitude nuclear detonation: P(t) ~ P(max).[(2t2)/(1 + t4)], where t is time (as measured in units of the time taken for the final peak thermal pulse to occur).

This useful equation adds to the vast collection of empirical formulae in his 50-odd pages long detailed mathematical analysis, 'Review of Nuclear Weapons Effects' in the Annual Review of Nuclear Science, v18, 1968, and many blast wave reports from the early 1980s. However, he has to quote the thermal time scaling law from Glasstone and Dolan, which is nonsense.

Glasstone and Dolan states that the time of peak thermal power from a low air burst is: 0.0417W(kt)0.44 seconds. This is a fiddle, based on computer calculations which use an imperfect knowledge of properties of hot air. Nuclear test data from all the American low altitude tests, 1945-62, shows that the empirical law is quite different: 0.036W(kt)0.48 seconds. In a later post I'll collect the most important empirical formulae together with the test data from which they are derived, and describe the controversy which resulted when Dolan took over editorship of Capabilities of Nuclear Weapons (and The Effects of Nuclear Weapons) and moved most nuclear effects predictions from being based on test data to being based on computer calculations of physics from first principles.

The reason for the false time of second thermal maximum must be to compensate for a change in the shape of the thermal curve for higher yields. Glasstone and Dolan show thermal curve for low yield weapons in which 20% of the thermal radiation is emitted by the time of final peak thermal power. Dolan's DNA-EM-1 however gives a computer simulation curve showing that about 30% is emitted by that time for a high yield weapon (also air burst in approximately sea level air). Brode in the Annual Review of Nuclear Science 1968 gives a formula which shows that the thermal yield increases from 40% of initial fireball energy to 44% as yield increases from say 1 kt to 10 Mt or so.

What physically happens is that the radius and time of final peak fireball radiation power scale as about W2/5 and W0.48, respectively. However the principal thermal minimum (before the final maximum brightness) is caused by nitrogen dioxide created in the shock front, and the range of this shielding and duration of this shielding both scale as W1/3. Hence, as the bomb yield increases, the shock caused nitrogen dioxide shield covers less of the fireball and covers a smaller proportion of the thermal radiation curve.

This means that the percentage of bomb which is radiated as thermal energy increases slightly and the fraction which is radiated by the time of the final maximum also increases. Instead of presenting a lot of thermal emission radiation curves for different yields, Glasstone and Dolan 1977 instead apparently used the standard 20 kt thermal power curve and changed the formula for the second maximum so that it was defined not as the true time for second maximum, but rather as the time by which 20% of the thermal energy was emitted, so that it was in reasonable agreement with the curves presented.

Many other fiddles exist in Glasstone & Dolan 1977. In January 1963, Dr Edward C. Freiling and Samuel C. Rainey of the U.S. Naval Radiological Defense Laboratory issued a 17 page draft report, Fractionation II: On Defining the Surface Density of Contamination, stating: "The section ‘Radiation Dose Over Contaminated Surfaces,’ in The Effects of Nuclear Weapons, is out of date with regard to the account it takes of fractionation effects. This report presents the technical basis for revising that section. It recommends that the exposure rate from fractionated debris be presented as the product of a contamination surface density with the sum of 3 terms. The 1st term is the exposure rate contribution of refractorily (unfractionated) behaving fission products. The 2nd term is for volatilely (fractionated) behaving fission product nuclides. The 3rd term expressed the contribution of the induced activities."

This criticism of The Effects of Nuclear Weapons was deleted in the final March 1963 version of the report (USNRDL-TR-631). However, criticism of Glasstone’s neglect of fractionation varying with distance in the fallout pattern continued with R. Robert Rapp of the RAND Corporation in 1966 authoring report RM-5164-PR, An Error in the Prediction of Fallout Radiation, and John W. Cane in 1967 authoring DASIAC Special Report 64, Fallout Phenomenology: Nuclear Weapons Effects Research Project at a Crossroads. (This was all ignored in the 1977 edition.)

Glasstone and Dolan state, for example, that water surface bursts only deposit 30% of their radioactivity as local fallout. This figure comes from inaccurate analysis during Operation Redwing in WT-1318 page 57, which says that water surface bursts Tewa and Flathead deposited 28% and 29% of their fallout activity locally (within areas of 43,500 and 11,000 square miles respectively). However, this is misleading as the same report says that the water surface burst Navajo deposited 50% of its fallout activity locally over 10,490 square miles, while it states that the land surface burst Zuni deposited 48% of its fallout activity locally over 13,400 square miles. On 9 July 1957, B. L. Tucker of the RAND Corporation showed, in his secret report Fraction of Redwing Activity in Local Fallout, that these percentages were based on a false conversion factor from dose rate to activity, and that by using the correct conversion factor, all these tests deposited about 68-85% for corrected Redwing data. Also, more accurate data from Operation Hardtack in 1958 shows that water surface bursts deposit similar local fallout to ground surface bursts, although water burst fallout is less fractionated.

During the 1960s, the consequences of fission product fractionation for discussions of the ‘percentage’ of radioactivity deposited as local fallout, and also for the radiation decay rate as a function of particle size and therefore of downwind distance, occurred in the Defence Atomic Support Agency of the U.S. Department of Defence. It was established that there is no single fixed percentage of radioactivity in early fallout, since the different fission products fractionate differently so the percentage depends on the nuclides being considered; if attempts are made to add up the total radioactivity, it is found that beta and gamma radioactivities of the different fission products differ, as does the average gamma ray energy of fallout fractionated to different degrees at the same time after detonation, so it is not scientific to give a single ‘average’ percentage of the total radioactivity in local fallout; considerations must be done for each fission product separately. For example, after the Hardtack-Oak surface burst 49% of Cs-137 and 89% of Mo-99 were deposited within 24 hours of burst; while Glasstone states that 60% of the activity is deposited within 24 hours. This makes the data on fallout effects in The Effects of Nuclear Weapons both misleading scientific explanation, and also generally inaccurate for making any sort of numerical calculation of fallout.

In a previous post, it was mentioned that the official U. S. manual in 1957 exaggerated the ignition radius for shredded dry newspaper for a 10-Mt air burst on a clear day by a factor of two, and that fire areas were therefore exaggerated by a factor of four (circular area being Pi times the square of radius).

It also exaggerated the range of blistered skin (second degree burns):

Dr Carl F. Miller, who worked for the U.S. Naval Radiological Defense Laboratory at nuclear tests, hit out in the February 1966 Scientist and Citizen: ‘Reliance on the Effects of Nuclear Weapons has its shortcomings... I was twenty miles from a detonation ... near ten megatons. The thermal flash did not produce the second-degree burn on the back of my neck, nor indeed any discomfort at all.’

The online NATO HANDBOOK ON THE MEDICAL ASPECTS OF NBC DEFENSIVE OPERATIONS, FM 8-9, 1996, calculates in Table 4-VI that second-degree skin burns even from 10 Mt air bursts (where the range is greater than from surface bursts) would only extend to a range of 14.5 km (9 miles) in a typical city with atmospheric visibility of 10 km.

There is plenty of evidence that the high mortality to thermal burns victims was due to combined thermal and nuclear radiation exposure, since the nuclear radiation doses to people in the open at thermal burns ranges were sufficient to depress the bone marrow which produces white blood cells. The maximum depression in the white blood cell count occurs a few weeks after exposure, by which time the thermal burns had generally become infected in the insanitary conditions the survivors had to make do with. This combination of depressed infection-fighting capability and infected burn wounds often proved lethal at Hiroshima and Nagasaki, but it is essential to note that apparently severe burns were more superficial than is made out by most propaganda, nobody was vaporized:

‘Persons exposed to nuclear explosions of low or intermediate yield may sustain very severe burns on their faces and hands or other exposed areas of the body as a result of the short pulse of directly absorbed thermal radiation. These burns may cause severe superficial damage similar to a third-degree burn, but the deeper layers of the skin may be uninjured. Such burns would heal rapidly [unless the person also receives a massive nuclear radiation dose], like mild second-degree burns.’ – Dr Samuel Glasstone and Philip J. Dolan, editors, The Effects of Nuclear Weapons, U.S. Department of Defence, 1977, p. 561.

The British Home Office Scientific Advisory Branch, whose 1950s and 1960s reports on civil defence aspects of nuclear weapons tests are available at the U.K. National Archives (references HO229, HO338, etc., also see DEFE16 files), immediately distrusted the American manual on several points. Physicists such as George R. Stanbury from the Scientific Advisory Branch had attended Operation Hurricane and other U.K. nuclear weapons tests to measure the effects!

However, when they published the British data in civil defence publications, they were quickly 'discredited' by physics academics using the American manual. The problem was that they could not reveal where their data came from, because of secrecy. This plagued civil defence science not only in Britain but also in America throughout the cold war. The public distrusted all but the most exaggerated 'facts', being led by propaganda from various sources (including the Soviet-funded lobbies such as the U.S.S.R.-controlled 'World Peace Council') that the only way to be safe was to surrender by unilateral nuclear disarmament. (Similarly, Japan was supposedly safe from nuclear attack in August 1945 because it had no nuclear weapons.)

Professor Freeman Dyson helpfully explained the paradox in his 1984 book Weapons and Hope: '[Civil defence measures] according to the orthodox doctrine of deterrence, are destabilizing insofar as they imply a serious intention to make a country invulnerable to attack.'

This political attitude meant simply that without civil defence, both sides need fewer weapons to deter the other side. Therefore by one way of looking at the logic, it is more sensible to have no civil defence, and this will allow both sides to agree to have a minimal number of weapons to deter the other side. This set in during the 1960s, and spread from passive civil defence to active defences like ABM treaties, where both the U.S.S.R. and the U.S. agreed to limit the number of ABM (anti ballistic missile) systems.

This was I believe signed by people like President Nixon, who were regarded as slightly cynical by some people. The problem with pure deterrence is that it doesn't help you if you have no civil defence and a terrorist attacks you, or there is a less than all-out war. (Even if you disarm your country of nuclear weapons entirely, you are obviously no more safe from a nuclear attack than Japan was in August 1945 when both Hiroshima and Nagasaki were blasted. So you still need civil defence, unless you start pretending - as many do - that people were magically vaporised in the hot but rapidly cooling nitrogen dioxide-coloured 'fireball' of hot air, and falsely claim from this lie that duck and cover would not have helped any burned, battered and lacerated survivors.)

In America, nuclear age civil defence had begun with the crazy-sounding but actually sensible 'duck and cover' advice of 1950, just after the first Russian nuclear test. Effects like shattered glass, bodily displacement, and thermal flash burns covered the largest areas in Hiroshima and Nagasaki, and were the easiest to protect against as nuclear test data shows. The higher the overpressure, the more horizontally the glass fragments go, so you can avoid lacerations by ducking, which also stops burns and bodily displacement by the wind drag or dynamic pressure. The last big civil defence expenditure was President Kennedy's fallout program of 1961. Kennedy equipped all public building basements throughout America with food, radiation meters and water. (Something like two million radiation meters had to be made.)

In Britain the 'Civil Defence Corps', which had been honored during the Blitz in World War II, was finally abolished in March 1968, after ridicule. (Civil defence handbook Number 10, dated 1963, was held up in parliament for public ridicule, mainly because of one sentence advising people driving cars to 'park alongside the kerb' if an explosion occurred. This was as regarded patronising and stupid by the British Government of 1968 - which was, of course, a different one from that of 1963 when the manual was published in response to public demand stemming from the Cuban missiles crisis.)

Recently Dr Lynn Eden has written a book with input from firestorm modeller Dr Harold Brode and various other physicists, Whole World on Fire: Organizations, Knowledge, and Nuclear Weapons Devastation (Ithaca, N.Y.: Cornell University Press, 2004), which makes the case that a technical U.S. Defence Intelligence Agency's secret publication, Physical Vulnerability Handbook - Nuclear Weapons (1954-92), never included any predictions of fire damage! (Some reviewers of that book have falsely claimed that fire risks were covered up, which is absurd seeing that the 1957 non-secret U.S. Department of Defense The Effects of Nuclear Weapons book falsely shows that dry shredded newspaper would be ignited 56 km from a 10 megaton air burst, which was reduced to half that, 28 km in the 1977 edition. Dr Eden misses this completely and tends to poke fun at civil defence in her presentation of the effects of the 1953 Encore nuclear test thermal ignition experiments in Nevada. We'll look at the facts in a later post.)

However, the scientific reference is not that physical vulnerability handbook, but is the U.S. Department of Defense's secret manual Capabilities of Nuclear Weapons, which does contain fire ignition predictions. The tests and the science will be examined in later posts.

Photo credit: Hiroshima photo in colour was taken by the United States Air Force.

Wednesday, March 29, 2006

Outward pressure times area is outward force...

Image above is taken from Dr Samuel Glasstone's Effects of Nuclear Weapons 1957. The outward force of the blast always has an equal and opposite reaction (3rd law of motion), in this case underpressure (suction), pulling instead of pushing. See the tree stand in the middle of this video clip of the 15 kiloton Grable nuclear test. Close to ground zero, before the suction phase develops, the reaction is simply the symmetry of the blast (the reaction of the Northwards part of the blast is the Southwards moving blast, while there is still high pressure connecting them - this breaks down when a vacuum forms near ground zero, and from then on the reactive force is the inward or suction blast phase). Likewise, in a sound wave, you have to have an outward pressure followed by an inward (underpressure) force. The relationship between force and pressure is force equals pressure times area acted upon.

This whole approach to understanding sound waves, explosion blast waves, and consequently the big bang gravity mechanism, is suppressed. The logic that you get an inward force in an explosion (which by Newton's 3rd law balances the outward force) is also inherent in the implosion principle of nuclear weapons, as Glasstone explained:


If you don't have an equal and opposite reaction in a pressure wave, it isn't a sound wave.

The force you get against your eardrum isn't just a push, but a push followed by equal pull.

This mechanism explains the gauge boson inward push in the big bang, predicting gravity.

The outward force in any explosion always has an equal and opposite reaction (Newton's 3rd empirical law). If you just push air, the energy disperses without propagating as a 340 m/s oscillatory sound wave. Air must be oscillated to create sound. It delivers an oscillatory force, outward and then inward. Merely using wave equations does not explain the physical process, even where the maths happens to give a good fit to data. Sound waves are particulate molecules deep down, carrying an oscillatory force.

This makes various predictions and contains no speculation whatsoever, it is a fact based mechanism, employing Feynman's mechanism as exhibited in the Feynman diagrams - virtual photon exchange causing forces in QFT. He noted that path integrals has a deeper underlying simplicity:

"It always bothers me that, according to the laws as we understand them today, it takes a computing machine an infinite number of logical operations to figure out what goes on in no matter how tiny a region of space, and no matter how tiny a region of time. How can all that be going on in that tiny space? Why should it take an infinite amount of logic to figure out what one tiny piece of space/time is going to do? So I have often made the hypothesis that ultimately physics will not require a mathematical statement, that in the end the machinery will be revealed, and the laws will turn out to be simple, like the chequer board with all its apparent complexities." - Richard P. Feynman, Character of Physical Law, Penguin, 1992, pp 57-8.

(In the same book he discusses the problems with the LeSage gravity mechanism as per 1964.)

'Clean' nuclear weapon tests: Navajo and Zuni


Time magazine, Monday, Jul. 08, 1957
THE PRESIDENCY: The Clean Bomb


"Three of the nation's leading atomic scientists were ushered into the White House one morning last week by Atomic Energy Commission Chairman Lewis Strauss for a 45-minute conference with the President. The scientists: Edward Teller, credited with the theoretical discovery that led to a successful H-bomb, Ernest O. Lawrence, Nobel Prizewinning director of the University of California's radiation laboratory at Livermore, Calif., and Mark M. Mills, physicist and head of the lab's theoretical division. They brought a report of grave but potentially hopeful meaning. In the lab at Livermore, they told the President, scientists have found how to make H-bombs that will be 96% freer from radioactive fallout than the first models."


Above: clean-nuclear weapons physicist Dr Mark M. Mills testifying during his testimony before the Congressional Joint Atomic Energy Committee hearings on The Nature of Radioactive Fallout and Its Effects on Man, 1957 (the testimony is linked here in PDF format). Dr Mills was tragically killed in a helicopter accident during torrential rain on April 6, 1958, during the test preparations at Eniwetok Atoll, so the successful secret 1956 very "clean" test of the 4.5 Mt, 95% fusion, 5% fission Redwing-Navajo test was never publically demonstrated in the scheduled repeat Pinon test in 1958 (for comprehensive technical details of the Pinon, see Dr Gerald Johnson's 1958 Handbook for United Nations Observers, Pinon Test, Eniwetok, report UCRL-5367, PDF file linked here). After Dr Mills died, the public proof-testing of the clean bomb scheduled as Hardtack-Pinon was cancelled for weak reasons:

“[Lithium-7 deuteride and lithium-6 deuteride fusion fuel] costs can be estimated from the market price for lithium – with a lithium-6 content of 7.5 % - and with the advertised prices for heavy water [containing deuterium]. The latter sells for $28 per pound. ... the separation cost for lithium-6 ... should not be excessive since the isotopes Li-6 and Li-7 differ in mass by as much as 15 % and are therefore relatively easy to separate. My estimate for Li-6 D is $400 per pound. ... Making conservative assumptions about the fission yield in the [dirty U-238 fission] jacket, one concludes that a ton of TNT equivalent can be produced in the jacket for a fraction of one cent. ... It would undoubtedly be more expensive to construct a bomb without [a U-238 fission jacket]. And it would certainly be a much more difficult technical undertaking, since the success of Stage II [fusion of lithium deuteride] strongly depends upon the presence of the jacket. The neutron linkage and the cyclic nature of the multi-stage bomb make for a marriage between fission and fusion.”

- Dr Ralph E. Lapp, “The Humanitarian H-Bomb”, Bulletin of the Atomic Scientists, September 1956, p. 264.


Lapp's cynical complaint of the high relative cost of lithium-6 to U-238 in thermonuclear weapons ignores the fact that on average 50% of the yield of ordinary "dirty" stockpiled thermonuclear weapons comes from fusion anyway! By replacing the U-238 with lead, you're making no difference to the cost of the weapon: you're simply reducing the total yield and increasing the percentage due to fusion by a factor of 10 or more! In addition, Lapp ignores the fact that you simply don't need lithium-6 deuteride in a thermonuclear bomb: you can use natural lithium cheaply instead! In 1954, the highly efficient 15 Mt Castle-Bravo test used lithium only enriched to 40% lithium-6, while the successful 11 Mt Castle-Romeo test used only natural lithium deuteride (7.5% lithium-6 and 92.5% lithium-7), with no lithium enrichment. Sure, the heat released in the fission of the U-238 pusher by fusion neutrons acts as a catalyst to boost the fusion stage efficiency, and you lose that boost when you remove the U-238 jacket. But the successful tests of clean weapons prove that this is not an insuperable objection. Dr Samuel Glasstone, author of the secret nuclear weapon design physics report WASH-1037/8, 1962, 1963, 1972a and 1972b, wrote in his 1985 Funk & Wagnalls Encyclopedia (incorporated into Microsoft's Encarta 1998 multimedia encyclopedia) article on Nuclear Weapons:

"(E) Clean H Bombs

"On the average, about 50 percent of the power of an H-bomb results from thermonuclear-fusion reactions and the other 50 percent from fission that occurs in the A-bomb trigger and in the uranium jacket. A clean H-bomb is defined as one in which a significantly smaller proportion than 50 percent of the energy arises from fission. Because fusion does not produce any radioactive products directly, the fallout from a clean weapon is less than that from a normal or average H-bomb of the same total power. If an H-bomb were made with no uranium jacket but with a fission trigger, it would be relatively clean. Perhaps as little as 5 percent of the total explosive force might result from fission; the weapon would thus be 95 percent clean. The enhanced-radiation fusion bomb, also called the neutron bomb, which has been tested by the United States and other nuclear powers [1 kt, 500 metres altitude air burst] is considered a tactical weapon because it can do serious damage on the battlefield, penetrating tanks and other armored vehicles and causing death or serious injury to exposed individuals, without producing the radioactive fallout that endangers people or structures miles away."


Above: This newspaper article, "Clean H-Bomb Test Junked as U.S. Fears Mammoth Propaganda Dud", in The Deseret News, July 30, 1958, highlights the controversy in 1958 that fusion neutrons escaping into the atmosphere turn some nitrogen atoms into radioactive carbon-14, just as nuclear radiation from the sun does. But neutron-induced activities are a trivial hazard compared to the fission products from a "dirty" (high fission yield) surface burst. (See the declassified report USNRDL-TR-215, linked here, which contains the accurately measurements of the very small ratios of atoms/fission for neutron-induced Co-60 and other radionuclides in the 95% clean 1956 Navajo nuclear test fallout.) Another claim was that communist countries declined to attend the clean proof-test. But American could have still gone ahead and published the facts about clean nuclear weapons tests.


Above: neutron induced activities in atoms per fission depend upon bomb construction, particularly fission yield fraction ("cleanliness"). This table of data is based on the same source as Harold A. Knapp's 1960 table of accumulated doses from neutron induced activities in fallout (shown below), and is taken from the 1965 U.S. Naval Radiological Defense Laboratory report USNRDL-TR-1009 by Drs. Glenn R. Crocker and T. Turner. (This report is available as a 10 MB PDF download here. For Crocker's report on the fission product decay chains, see this link.)


Above: neutron induced activity gamma doses are smaller than fission product gamma doses, so "clean" nuclear weapons - despite releasing neutrons and creating some neutron induced activity - do eliminate much of the fallout problem.

Above: fallout from 95% 'clean' bomb test Navajo, Bikini Atoll, 1956 (WT-1317 ). Surface burst in the lagoon on a barge, the yield was 4.5 Mt, and it was only 5% fission. Each square in this and the next map has side of 20 minutes of latitude/longitude (= 20 nautical miles or 37 km). The radiation levels are relatively low, 20 times smaller than a fission weapon of similar yield.

Above is the best fallout pattern (from U.S. weapon test report WT-1317 by Drs. Terry Triffet and Philip D. LaRiviere) from the Zuni shot of 3.53 megatons, 15% fission at Bikini Atoll in 1956. It combines all available data, unlike the data in report DASA-1251, which gives unjoined data for the lagoon and the ocean. The ocean data was obtained in three ways, since fallout sinks in water. First, ships lowered probes into the water and measured the rate the fallout sank with time. Second, ships took samples of water from various depths for analysis. Third, the low level of radiation over the ocean was measured by both ships and aircraft, correcting for altitude and shielding of the geiger counter.

This particular test is unusual, as it was a surface burst on land (coral island), and was extensively studied; they even fired rockets through the different parts of the cloud at 7 and 15 minutes after burst, containing miniature radiation meters and radio transmitters, to map out the radioactivity distribution (it worked, showing toroidal distribution!). Ships were located in the fallout area at various locations to determine the fallout arrival time, build up rate (which was slow, due to the huge mushroom cloud which took time to pass overhead and diffused lengthways), decay rate after fallout arrival, mass of fallout and visibility of fallout deposit, and the chemical abundances of the various nuclides in fallout at different locations. Near the burst, large fallout particles arrive which fallout of the fireball before gaseous nuclides in decay chains have decayed into solids and condensed, so the biggest fallout particles, near ground zero, have relatively little I-131, Cs-137, and Sr-90. Gaseous precursors like xenon and krypton prevent Cs and Sr decay chains from condensing early, while iodine is volatile itself. Smaller fallout particles, while posing an overall smaller radiation hazard, have relatively more of these internal hazards (I-131 concentrates in the thyroid gland if ingested, say by drinking milk, while Cs-137 goes into muscle and Sr-90 goes into bone, assuming it is in a soluble form, which is of course not the case if the ground burst is on silicate-based soil, because the radioactivity is then trapped inside glass spheroids).

Here is a report of Dr. Hans A. Bethe, working group chairman, originally 'Top Secret - Restricted Data', to the President's Science Advisory Committee, dated 28 March 1958, defending 'clean nuclear weapons tests', courtesy of Uncle Sam:

http://www.hss.energy.gov/healthsafety/ihs/marshall/collection/data/ihp1b/7374_.pdf

Pages 8-9 defend clean nuclear weapons! As stated, Zuni was only 15% fission, so it was 85% clean. The dose rates given on these fallout patterns are extrapolated back to 1 hour, before the fallout had completely arrived anywhere, so are far higher than ever occurred anywhere! The true dose rates are lower due to decay during wind-carried transit. The dose rates also refer to the equivalent levels on land, which are about 535 times higher than over ocean at 2 days after burst, because the fallout landing on the ocean sinks steadily, and the water shields most of the radiation. The average decay rate of the fallout was t^-1.2 for all weapons tests. It is amazing how much secrecy there was during the cold war over thecivil defence data in WT-1317. The point is, fallout is not as bad as some people think, just like blast and cratering.

Co-60 bomb research

Wikipedia insert: Extensive residual radioactivity experiments and civil defence fallout studies were made during these tests. The Antler-1 test contained normal cobalt-59 which upon neutron capture was transmuted into radioactive cobalt-60 [1]. This provided a way to measure the neutron flux inside the weapon, although it was also of interest from the point of view of radiological warfare.

The then Science Editor of the New York Times, William L. Laurence, wrote in his 1959 book Men and Atoms (Simon & Schuster, New York, p. 195):

‘Because the cobalt bomb could be exploded from an unmanned barge in the middle of the ocean it could be made of any weight desired ... Professor Szilard has estimated that 400 one-ton deuterium-cobalt bombs would release enough radioactivity to extinguish all life on earth.’

The total amount of gamma ray energy emitted from cobalt-60 is only 2.82 MeV and this meagre energy release is spread over a statistical mean time of 1.44 times the 5.3 years half life of cobalt-60. (The number 1.44 is given approximately by 1 over the natural logarithm, i.e., the log to the base e, of 2, since this is the conversion factor between half-life and mean life time for radioactivity.) For comparison, every neutron used to fission an atom of U235, Pu239, or U238 releases 200 MeV of energy, including 30 MeV of residual radioactivity.

Hence, fission is by far the most efficient way to create radioactive contamination. The dose rate from Co-60 in the Antler-1 fallout was insignificant until most of the fission products had decayed, and only a few large pellets of Co-60 were found afterwards. The overall contribution of Co-60 to the fallout radiation was trivial compared to fission products and shorter-lived neutron induced activities in the bomb materials.

A study was done into the penetration of the fallout gamma radiation from the Antler tests by British Home Office and Atomic Weapons Research Establishment scientists A. M. Western and H. H. Collin in Maralinga. The results in their AWRE paper Operation Antler: the attenuation of residual radiation by structures, were published in Fission Fragments No. 10, June 1967, and showed the the long-term integrated fallout gamma radiation doses were reduced by a factor of 5 for a mass shielding of 312.4 kg per square metre, which is equivalent to a thickness of 15 cm of earth. A mass shielding of 781.1 kg per square metre stopped 96.6 % of the gamma rays, and this is equivalent to a protection factor of more than 29 by a shield of 38 cm of earth. America also performed studies which showed how fallout problems can be avoided.

Additional information:

NEUTRON CAPTURE-INDUCED NUCLIDES IN FALLOUT

Dr Terry Triffet and Philip D. LaRiviere, Operation Redwing, Project 2.63, Characterization of Fallout, U.S. Naval Radiological Defense Laboratory, 1961, Secret – Restricted Data, weapon test report WT-1317, Table B.22: some 21 radioactive isotopes of 19 different radioactive decay chains from neutron induced activity are reported for megaton range tests Navajo (lead pusher, 5 % fission), Zuni (lead pusher, 15 % fission) and Tewa (U-238 pusher, 87 % fission) are reported. Summing all the 19 separate decay chains abundances (of radioactive capture atoms per fission) gives results of:

15.6 atoms/fission for Navajo (5 % fission),

7.03 atoms/fission for Zuni (15 % fission), and

1.25 atoms/fission for Tewa (87 % fission).

(These data are computed from a full table which includes some nuclides not listed in WT-1317. I'll give that complete listing later. At present data tables do not seem to format properly on this blog site.)

But even for a very 'clean' bomb like Navajo, fission products dominate the fallout radiation dose. The sodium isotope Na-24 (15 hours half life) is generally considered the most important environmental form of neutron induced activity, and the abundance of Na-24 was only 0.0314 atom/fission in Navajo, 0.0109 atom/fission in Zuni, and 0.00284 atom/fission in Tewa. (These tests all involved large quantities of sea water being irradiated, Navajo and Tewa were water surface bursts and Zuni was on a small island surrounded by ocean.)

Far more important were U/Np-239, -240 and U-237 (which is created by a reaction whereby one neutron capture in U-238 results in two neutrons being emitted). The capture atoms/fission for Navajo, Zuni and Tewa were respectively 0.04, 0.31 and 0.36 for U/Np-239, 0.09, 0.005, and 0.09 for U/Np-240, and 0.09, 0.20 and 0.20 for U-237. (See also USNRDL-466.) These can emit as much radiation as fission products at the intensely critical early times of 20 hours to 2 weeks after detonation. They emit very low energy gamma rays, so the average energy of fallout gamma rays for a bomb containing a lot of U238 is low during the sheltering period, 0.2-0.6 MeV, and this allows efficient shielding to be done far more easily than implied by most civil defence calculations (which are based on gamma radiation from fission products with mean gamma energy of 0.7-1 MeV).

This was first pointed out based on British nuclear test fallout data (for Operation Totem and other tests) by George R. Stanbury in a Restricted U.K. Home Office Scientific Advisory Branch report in 1959, The contribution of U239 and Np239 to the radiation from fallout (although this paper originally contained a few calculation errors, the point that the average fallout gamma ray energy is lower than for fission products stands). You get much better shielding in a building that American calculations show, due to their incorrect use of 0.7-1 MeV mean gamma ray energy. The mean gamma ray energy at 8 days after Castle tests was only 0.34 MeV (WT-934 page 56, and WT-915 page 145; see also WT-917 pages 114-116, and also see of course WT-1317).

When tritium fuses with deuterium to produce helium-4 plus a neutron, the neutron’s mass is 20% of the total product mass, so the complete fusion of a 1 kg mixture of deuterium and tritium yields 0.2 kg of free neutrons, which – if all could be captured by cobalt-59 – would create 12 kg of Co-60. This was Professor Szilard’s basis for a ‘doomsday’ device.

However, Dr Gordon M. Dunning (b. 1910) of the U.S. Atomic Energy Commission, who was responsible for radiological safety during 1950s American tests, published calculations for such ‘cobalt-60 bombs’ (Health Physics, Vol. 4, 1960, p. 52). These show that a 100 megaton bomb with a thick cobalt-59 case, burst at a latitude of 45 degrees North, would produce an average Co-60 infinite-time gamma radiation exposure outdoors of 17 Roentgens in the band between 30 and 60 degrees North, around the earth. This ignores weathering of fallout, and assumes a uniform deposition.

The maximum rate at which this exposure would be received (outdoors), is 0.00025 Roentgens per hour, only 12 times greater than background radiation. Choosing a longer half-life reduces the intensity by increasing the time lapse between each particle emission; so the longer the half-life, the lower the intensity. If it is decaying rapidly, you can shelter while it decays. If the half-life is long, you can decontaminate the area before receiving a significant dose. No problem!

Creating Co-60 inside a weapon uses up precious neutrons, without releasing any prompt energy to help the nuclear fusion process, unlike U-238 fission, which releases both prompt energy and neutrons. Every neutron captured by Co-59 to produce radioactive Co-60 will lead to the release of only 2.82 MeV of radiation energy (one beta decay and two gamma rays). However, every neutron induced fission of uranium-238 releases about 200 MeV of energy, including more residual radiation energy than that released from Co-60. Therefore, fission gives a greater hazard than that from Co-6o and other neutron capture activities.

All of the escaping neutrons in an underwater or underground burst are captured in the water or soil, but only about 50% are captured by the water or soil in a surface burst. The amounts of neutron induced activity from the environment generally have a small effect, the highest activity being due to Na-24. In bombs containing U-238, the major neutron capture nuclides are Np-239 and U-237, which give off low energy gamma rays for the first few days and weeks. Shielding this radiation is easy.

The use of tungsten (W) carbide ‘pushers’ for clean nuclear weapons led to the discovery of W-185 (74 days half-life) in fallout from the 330 kt Yellowwood water surface burst at Eniwetok, 26 May 1958. It emits very low energy (0.055 MeV) gamma rays. Yellowwood produced 0.32 atoms of W-185 per fission, based on the ratio of W-185 to Zr-95 (assuming 0.048 atoms of Zr-95 per fission) in the crater sludge at 10 days after burst. (Frank G. Lowman, et al., U.S. Atomic Energy Commission report UWFL-57, 1959, p. 21.) W-185 was discovered on plankton and plant leaves, but was not taken up by the sea or land food chains. In fallout from the 104 kt, 30% fission Sedan shot at Nevada on 6 July 1962, W-187 (24 hours half-life) gave 55% of the gamma dose rate at 24 hours after burst, compared with 2% from Na-24 due to neutron capture in soil.

The ocean food-chain concentrates the neutron-capture nuclides iron (Fe) and zinc (Zn) to the extent that Fe-55 and Zn-65 constituted the only significant radioactivity dangers in clams, fish and birds which ate the fish after nuclear tests at Bikini and Eniwetok Atolls, during the 1950s. However, these nuclides are not concentrated in land vegetation, where the fission products cesium (which is similar to potassium) and strontium (which is similar to calcium) are of major importance. This is caused by the difference between the chemical composition of sea water and land. (Where necessary chemical elements are abundant, uptake of the chemically similar radioactive nuclide is greatly reduced by dilution.)

Fish caught at Eniwetok Atoll, a month after the 1.69 Mt Nectar shot in 1954, had undetectably low levels of fission products, but high levels of Fe-55 (95% of activity), Zn-65 (3.1%), and cobalt isotopes. In terns (sea birds) at Bikini Atoll, Zn-65 contributed almost all of the radioactivity after both the 1954 and 1956 tests. Fe-55 gave off 73.5% of the radioactivity of a clam kidney collected in 1956 at Eniwetok, 74 days after the 1.85 Mt Apache shot; cobalt-57, -58, and –60 contributed 9.6, 9.2, and 1.8%, while all of the fission products only contributed 3.5%.

Fish collected at Bikini Atoll two months after the 1956 Redwing series which included Zuni, Navajo and Tewa, had undetectably low levels of fission products, but Zn-65 contributed 35-58% of the activity, Fe-55 contributed 15-56%, and cobalt gave the remainder. (Frank G. Lowman, et al., U.S. Atomic Energy Commission report UWFL-51, 1957.)

In 1958, W.J. Heiman of the U.S. Naval Radiological Defense Laboratory released data on the sodium-24 activity induced in sea water after an underwater nuclear explosion in which 50 % of the gamma radiation at 4 days after burst is due to Np-239. He found that Na-24 contributed a maximum of 7.11 % of the gamma radiation, at about 24 hours after burst (Journal of Colloid Science, Vol. 13, 1958, pp. 329-36).

Hence even in a water burst, Np-239 radiation is far more important than Na-24.

Perhaps the most important modification in the April 1962 edition of The Effects of Nuclear Weapons was the disclosure that the radioactive fallout from nuclear weapons contains substantial amounts of radioactive nuclides from neutron capture in U-238. This had been pointed out by scientist George Stanbury (who worked with data from nuclear tests, and had attended British nuclear tests to study the effects) of the British Home Office Scientific Advisory Branch in report A12/SA/RM 75, The Contribution of U239 and Np239 to the Radiation from Fallout, November 1959, Confidential (declassified only in June 1988). Both Mr Stanbury and The Effects of Nuclear Weapons 1962 found 40% of the gamma radiation dose rate from fallout is the typical peak contribution due to Neptunium-239 and other capture nuclides (e.g., U-237, which is formed by an important reaction whereby 1 neutron capture in U-238 is followed by 2 neutrons being released), which all emit very low energy gamma radiation, and are important between a few hours and a few weeks after burst, i.e., in the critical period for fallout sheltering.

Because of the low energy of the gamma rays from such neutron-capture elements, which are present in large quantities in both Trinity-type fission bombs (with U-238 tampers) and thermonuclear bombs like Mike and Bravo, the fallout is much easier to protect against than pure fission products (average gamma energy 0.7 MeV). However, The Effects of Nuclear Weapons, while admitting that up to 40% of the gamma radiation is from such nuclides, did not point out the effect on the gamma energy and radiation shielding issue, unlike Stanbury’s Confidential civil defence report. This discovery greatly stimulated the “Protect and Survive” civil defence advice given out in Britain for many years, although it was kept secret because the exact abundances of these bomb nuclides in fallout were dependent on the precise bomb designs, which were Top Secret for decades.


NEUTRON CAPTURE-INDUCED NUCLIDES IN FALLOUT

Scroll down for the table. There is an error with this blog system changing html tables by prefixing them with large unwanted empty spaces. I'll fix this issue when I have time.


Nuclides formed by neutron capture in the thermonuclear bomb, 189 metric tons steel barge (NAVAJO AND TEWA TESTS), and the surrounding sea water


Measured Bikini Atoll test data for thermonuclear weapon designs of various fission yields, and two types of fusion charge ‘pusher’*


Nuclide


Half-life


Exposure rate at 1 hour after detonation, (R/hr)/(kt/mi2) per capture atom/fission. 3 ft height, ideal theory, Triffet 61.


Redwing-Navajo


4.50 Mt, 5% fission


Lead (Pb) pusher


Bomb mass = 6.80 metric tons


Redwing-Zuni


3.53 Mt, 15% fission


Lead (Pb) pusher


Bomb mass = 5.51 metric tons


Redwing-Tewa


5.01 Mt, 87% fission


Uranium-238 pusher


Bomb mass = 7.14 metric tons


Abundance of neutron induced nuclides in total fallout, atoms per fission:


Na-24


15.0 hours


1284.7


0.0314


0.0109


0.00284


Cr-51


27.7 days


0.280


0.0120


0.00173


0.000297


Mn-54


312 days


0.614


0.10


0.011


0.00053


Mn-56


2.58 hours


2668


0.094


0.010


0.00053


Fe-55


2.73 years


0.00416


14.9


6.05


0.573


Fe-59


44.5 days


6.19


0.0033


0.00041


0.000167


Co-57


271 days


0.113


0.00224


0.0031


0.000182


Co-58


70.9 days


3.11


0.00193


0.0036


0.000289


Co-60


5.27 years


0.299


0.0087


0.00264


0.00081


Cu-64


12.7 hours


89.5


0.0278


0.0090


0.00228


Zn-65


244 days


0.531


0.00435


0.00720


0.0000489


Sb-122**


2.71 days


38.4


0


0.219


0


Sb-124**


60.2 days


6.92


0


0.073


0


Ta-180


8.15 hours


35.9


0.038


0.0411


0.01


Ta-182


115 days


2.67


0.038


0.0194


0.01


Pb-203


2.17 days


26.0


0.0993


0.050


0.0000178


U-237


6.75 days


6.50


0.09


0.20


0.20


U-239


23.5 minutes


173


0.04


U-239 ®
Np ®
Pu


0.31


U-239 ®
Np ®
Pu


0.36


U-239 ®
Np ®
Pu


Np-239


2.35 days


14.9***


U-240


14.1 hours


0 (no gamma rays)


0.09


U-240 ®
Np ®
Pu


0.005


U-240 ®
Np ®
Pu


0.09


U-240 ®
Np ®
Pu


Np-240


7.22 minutes


150


Total amount of neutron induced activity (capture atoms per fission):


* Compiled from the data in: Dr Terry Triffet and Philip D. LaRiviere, Operation Redwing, Project 2.63, Characterization of Fallout, U.S. Naval Radiological Defense Laboratory, 1961, originally Secret – Restricted Data (now unclassified), weapon test report WT-1317, Table B.22 and Dr Carl F. Miller, U.S. Naval Radiological Defense Laboratory report USNRDL-466, 1961, Table 11 on page 41, originally Secret – Restricted Data (now unclassified). The ‘pusher’ absorbs initial x-ray energy and implodes, compressing the fusion charge. Data for Fe-55 is based on the ratios of Fe-55 to Fe-59 reported by Frank G. Lowman, et al., U.S. Atomic Energy Commission report UWFL-51 (1957), and H.G. Hicks, Lawrence Livermore National Laboratory report UCRL-53505 (1984), assuming that the neutron capture ratios in iron were similar for shots Apache and Tewa. Data for Zn-65 is based on the ratios of Zn-65 to Mn-54 reported by F.D. Jennings, Operation Redwing, Project 2.62a, Fallout Studies by Oceanographic Methods, report WT-1316, Secret – Restricted Data, 1961, pages 115 and 120.

** The Zuni device contained antimony (Sb), which boils at 1750 C and was fractionated in the fallout. This is the only fractionated neutron capture nuclide. The data shown are for unfractionated cloud samples: for the close-in fallout at Bikini Lagoon the abundances for Sb-122 and Sb-124 are 8.7 times smaller.


***Note that this is not the maximum exposure rate from Np-239 (at 1 hour after detonation it is still increasing because it is the decay product of U-239).


“The first objection to battlefield ER weapons is that they potentially lower the nuclear threshold because of their tactical utility. In the kind of potential strategic use suggested where these warheads would be held back as an ultimate countervalue weapon only to be employed when exchange had degenerated to the general level, this argument loses its force: the threshold would long since have been crossed before use of ER weapons is even contemplated. In the strategic context, it is rather possible to argue that such weapons raise the threshold by reinforcing the awful human consequences of nuclear exchange: the hostages recognize they are still (or once again) prisoners and, thus, certain victims.”


- Dr Donald M. Snow (Associate Professor of Political Science and Director of International Studies, University of Alabama), “Strategic Implications of Enhanced Radiation Weapons”, Air University Review, July-August 1979 issue (online version linked here).


“You published an article ‘Armour defuses the neutron bomb’ by John Harris and Andre Gsponer (13 March, p 44). To support their contention that the neutron bomb is of no military value against tanks, the authors make a number of statements about the effects of nuclear weapons. Most of these statements are false ... Do the authors not realise that at 280 metres the thermal fluence is about 20 calories per square centimetre – a level which would leave a good proportion of infantrymen, dressed for NBC conditions, fit to fight on? ... Perhaps they are unaware of the fact that a tank exposed to a nuclear burst with 30 times the blast output of their weapon, and at a range about 30 per cent greater than their 280 metres, was only moderately damaged, and was usable straight afterwards. ... we find that Harris and Gsponer’s conclusion that the ‘special effectiveness of the neutron bomb against tanks is illusory’ does not even stand up to this rather cursory scrutiny. They appear to be ignorant of the nature and effects of the blast and heat outputs of nuclear weapons, and unaware of the constraints under which the tank designer must operate.”


- C. S. Grace, Royal Military College of Science, Shrivenham, Wiltshire, New Scientist, 12 June 1986, p. 62.

WHAT IS NUKEGATE? The Introduction to "Nuclear Weapons Effects Theory" (1990 unpublished book), as updated 2025

R. G. Shreffler and W. S. Bennett, Tactical nuclear warfare , Los Alamos report LA-4467-MS, originally classified SECRET, p8 (linked HE...