ABOVE: Comparison of predicted fallout pattern hot line with test result for the 5.01 Mt, 87% fission, three stage design tested on 21 July 1956: REDWING-TEWA (it was 39 inches in diameter, 135.5 inches long, and weighed 15,735 lbs; it had a U-238 pusher around the fusion stage, unlike the lead pushers used on the clean shots of REDWING, i.e. ZUNI and NAVAJO), fired at 15 ft above sea level on a barge in 25 ft deep very shallow water above the reef at Bikini Atoll (the crater left in the reef was 4000 ft in diameter and 129 ft deep). This is the accurate fallout pattern from WT-1317, which combines all lagoon and ocean fallout surveys, unlike the unreconciled inaccurate data in DASA-1251. The fallout prediction was done by Edward A. Schuert, using a hand calculation method, aboard ship under simulated tactical combat conditions, using the wind pattern obtained by releasing and tracking a weather balloon (USNRDL-TR-139, A Fallout Forecasting Technique with Results Obtained at the Eniwetok Proving Grounds).

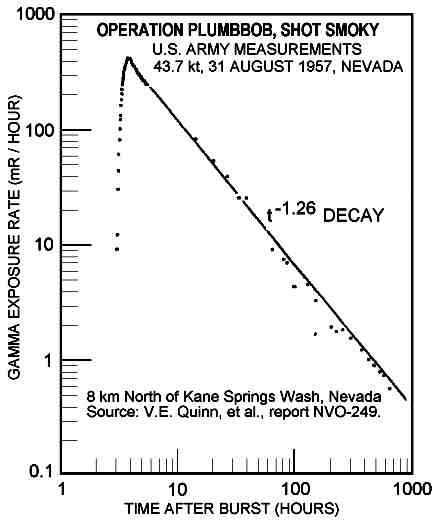
ABOVE: Hardtack-Oak, 8.9 megatons W-53 weapon test, seen 2 minutes after detonation. The photograph is taken from land and the test was on a 223 ton barge over 12 feet of water in Eniwetok Atoll's reef. The test device, which became the warhead design of the massive liquid-fuel Titan II missile (stockpiled until 1997), was 37 inches in diameter and 100.5 inches long, and weighed 6113 lb (these data come from the declassified DASA-1220, Nuclear Test Summary: Trinity to Hardtack, online as AD-A955363.) The 'saucers' and or 'skirts' below the mushroom cap are simply due to layers of moist air entrained by the vortex to greater altitudes, where the moist air expands and cools so that droplets condense in the lower pressures, to produce visible white cloud. The pulverised coral crater was 5740 feet diameter and 204 feet deep (many times the size for a detonation in a non-coral medium like ordinary soil). For fallout measurements at Oak, see online weapon test report WT-1625 available on line in two draft versions here and here (which include some tables which are blanked out in the final version) and a final version with extensive deletions here. Another Hardtack shot strikingly demonstrates the fallout decay rate: at 1 hour after the 18-kt Cactus surface burst on 6 May 1958, the gamma dose rate on the crater lip at Runit Island, Eniwetok, was 2,200 R/hr, but measurements showed it to have decayed 1,830,000-fold to 1.2 mR/hr in July 1971 (before decontamination; the crater was later used as a convenient nuclear waste dump and during the clean up of Eniwetok in the late 70s, and then topped off with a concrete dome).


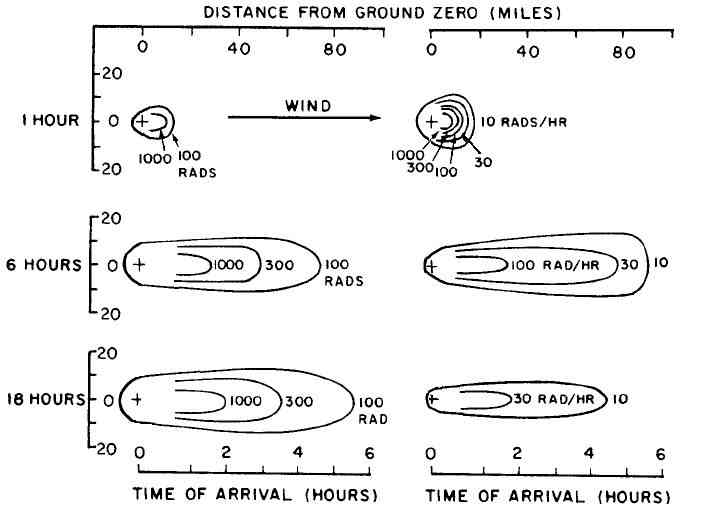
Above: the plume separation of 21 kt yield, 1,417 ft altitude air burst DOG shot on November 1, 1951 in Nevada, due to wind shear (the winds at different altitudes carrying different portions of the cloud at different rates and/or in different directions) was one of the important things in fallout prediction. There was a very detailed discussion of this wind shear problem at Pacific nuclear tests between USNRDL fallout expert Dr Terry Triffet and civil defense meteorologist Charles Shafer at the 22-26 June 1959 Congressional Hearings on The Biological and Environmental Effects of Nuclear War. Triffet testified:
'The contours from the large burst [REDWING-TEWA, 5.01 Mt, Bikini Atoll, 1956] are very irregular compared with those from the small burst. This is because the megaton burst produces a cloud which rises into the high level winds, and these may vary in direction. ... Notice the contours of the 1 kiloton burst [SUGAR, Nevada, 1951]. The cloud did not get into the high-level winds in this case; consequently, it is easy to see how the contours could be generalized into a cigar shape. ... There is another factor that should be brought out, too, and that is that the winds over the Eniwetok Proving Grounds [which included Bikini and Eniwetok Atolls] have a tendency to vary more than the winds over the United States - the high-level winds, that is.'
Shafer the next day testified:
'With regard to irregularities of fallout deposition, Dr Triffet showed yesterday an analysis of a multimegaton detonation [REDWING-TEWA, 5.01 Mt] in the Pacific in which there was a tremendous fanning out of the fallout with several hot spots. I would like to make it clear to the committee that ... we do not have that type of wind behavior in the United States except possibly in the Gulf States in the summertime, only one season out of four.'
‘The increased efficiency with which superweapons disperse radioactive materials is to some extent counter-acted by the delay in arrival of fallout from the high source cloud and the rapid rate of decay which occurs in the interim.’ – R.L. Stetson, E.A. Schuert, W.W. Perkins, T.H. Shirasawa, and H.K. Chan, Distribution and Intensity of Fallout, Operation Castle, Project 2.5a, U.S. Naval Radiological Defense Laboratory, weapon test report WT-915, January 1956, classified ‘Secret – Restricted Data’ (only 240 copies printed), p. 101.


ABOVE: American communities downwind in Nevada survived fallout without panic from this shot, Apple-2, on 5 May 1955. The dashed lines are the observed fallout contours measured with survey meters afterwards (gamma mR/hour at 12 hours after burst), and the solid lines are a 1955 prediction 'by the Weather Bureau using a hand computation with time and space variation of winds'. The actual fireball from this test is shown in the photo below. (This fallout illustration is taken from page 114 of U.S. Congressional Hearings before the Special Subcommittee on Radiation of the Joint Committee on Atomic Energy, The Nature of Radioactive Fallout and Its Effects on Man, 27 May - 3 June 1957.)
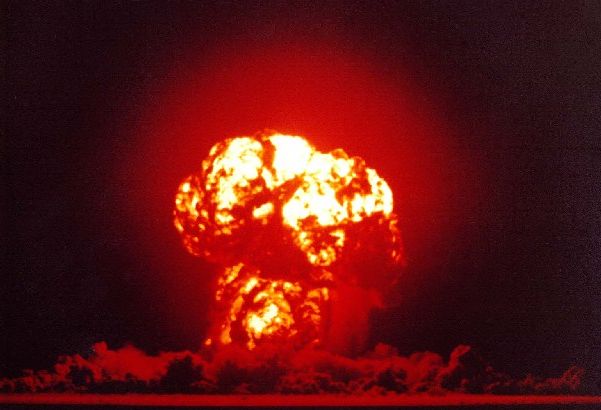
ABOVE: the Apple-2 fireball creating fallout. It was 29 kilotons yield, detonated on a 500 feet high tower. The 1955 Nevada test series, Teapot, which included Apple-2, released 24.5 megacuries of iodine-131. Apple-2 probably released 4.9 megacuries of this. A 1998 review of Nevada iodine-131 effects by the National Cancer Institute concluded that civilian thyroid gland exposure from Teapot totalled 41 million person-rads (11% of the total from New Mexico and Nevada tests, 1945-62). The human cost of Teapot, assuming their assumptions are correct in calculating the thyroid doses, is 13,000 cases of thyroid cancer, of which 650 will prove fatal. However, this was from drinking milk and was a known consequence of the testing programme. They could have eliminated this but didn't because statistically it was so small; similarly they could have banned cars to avoid many thousands more being killed. For iodine-131 inhalation studies during the Sedan nuclear test, see the online report Iodine Inhalation Study for Project Sedan.
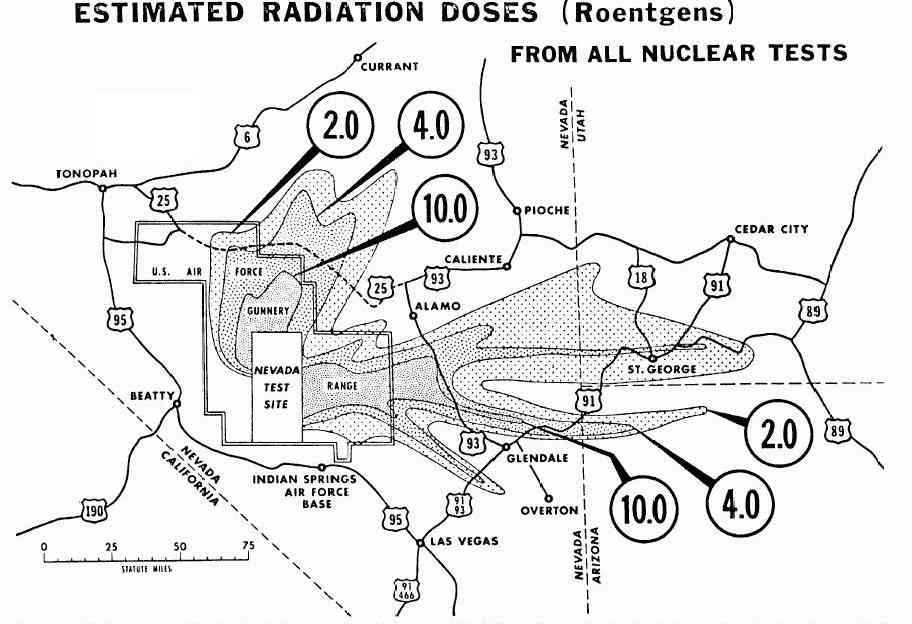 ABOVE: Dr Gordon Dunning's candid plot of total off-site fallout external gamma doses from Nevada tests to 1957, published on page 195 of the U.S. Congressional fallout hearings of June 1957, The Nature of Radioactive Fallout and Its Effects on Man.
 ABOVE: another Nevada map, updating the total external gamma doses from test fallout to 1959. The man responsible for health physics safety at American tests was Dr Gordon Dunning, I'll quote his 1957 testimony to U.S. Congressional Hearings below. Dr Dunning was completely candid and open about the iodine-131 thyroid exposure hazards, writing an article about "Effects of Nuclear Weapons Testing" (Scientific Monthly, Vol. 81, NO. 6, December 1955), organizing a fallout symposium in 1956, and he later wrote the U.S. Atomic Energy Commission's public information book on exposure data, Health Aspects of Nuclear Weapons Testing. He also wrote a public account of nuclear testing fallout in the Pacific, available online here and here, and compiled data on the CASTLE-BRAVO fallout here.
Fallout is predictable but even where you get heavy fallout, you don't have to get thyroid cancer from I-131. Dr Lubos Motl, an assistant physics professor at Harvard, recently remarked of Chernobyl in 1986: 'It seems that only 56 people were killed directly and 4,000 people indirectly [I-131 to thyroid from drinking milk, etc.].' Motl states:
'In a 1986 disaster that many were comparing to the third world war and that others have used to interrupt the progress in nuclear energy for at least 20 years, only 56 people were directly killed. A new 600-page report also estimates that the total number of indirect deaths caused by thyroid cancer - usually of the people who worked on the recovery of the plant after the disaster - will stay below 4,000. There has been no measurable deterioration of the public health in the surrounding areas. Was the anti-nuclear reaction to the Chernobyl accident appropriate? The Reference Frame does not think so and encourages the developed countries to build new nuclear power plants. The previous numbers were inflated because of miscalculations of exposition to radiation, and by attempts of various not-quite-honest countries to boost the financial assistance flowing to the area.Compare the new numbers with the typical number of people that are killed by natural disasters such as the typhoon in Southern Japan today (100,000 people ordered to flee their homes), plane crash that has just killed 147 people in Indonesia, and, of course, Katrina that has killed thousands. (The French Quarter will be fine.) And these disasters represent a small fraction of the people who die under more prosaic circumstances.'
Since the 1950s, it has been known that iodine-131 exposure is one of the easiest threats of fallout to take countermeasures against:
1. Don't drink fresh milk for a few weeks if the cattle are eating pasture grass contaminated with fresh fallout. (You can still use the milk to make cheese to be eaten after the 8-day half life of the iodine-131 has ensured its decay to insignificance.)
2. Or, continue using the milk so long as you can put the cattle indoors on winter feed until the iodine-131 (which has a mere 8 days half-life) has decayed.
3. A third option - which is not sensible unless the thyroid dose is expected to exceed 25 R - is to administer 130-milligram potassium iodide tablets to everyone daily who is drinking contaminated milk within a month of detonation; this blocks iodine-131 uptake by the thyroid by saturating it. But the evidence is that the risk of getting iodine-131 induced thyroid cancer from long-range fallout is so low that, in general, the low-risk of side effects from potassium iodide are similar or greater than those for radiation. The U.S. Federal Drugs Administration evaluated the risks of administering potassium iodide for thyroid blocking under emergency conditions:
'FDA guidance states that risks of side effects, such as allergic reactions, from the short-term use of relatively low doses of potassium iodide for thyroid blocking in a radiation emergency, are outweighed by the risks of radioiodine-induced thyroid nodules or cancer, if the projected dose to the thyroid gland is 25 rems or greater.'
Inhalation doses were measured and found to be generally trivial by comparison to doses from drinking milk, despite the volatility of iodine. At nuclear tests animals exposed did not acquire significant iodine-131 uptake by breathing air during and after fallout. Almost all the dose comes from drinking water from open rainwater-collecting cisterns (in the case of the Marshallese Islanders in the Pacific, 1954) and drinking fresh milk (in the case of the Americans during Nevada tests). Cresson Kearny of Oak Ridge National Laboratory has compared long range fallout on America from the fifth Chinese test (300 kt on 28 December 1966) with that released from the explosion and fire at the Chernobyl nuclear power station in 1986, which emitted a similar amount of iodine-131:
'The maximum measured radioactive contamination of milk in the United States by iodine-131 from the Chernobyl disaster was in milk produced by cows grazing on pasture in Washington: 560 picocuries per liter. The much greater potential danger from trans-Pacific war fallout is brought out by the fact that the approximately 300-kiloton Chinese test explosion of December 28, 1966 resulted in worse iodine-131 contamination of milk produced by a cow grazing on pasture near Oak Ridge, Tennessee: 900 picocuries per liter.'
Iodine-131 has a half life of just 8 days, so you don't need to give up fresh milk for very long after a nuclear explosion in order to eradicate the great hazards of thyroid cancer from fallout. The U.S. National Institute of Cancer factsheet states:
'Iodine 131 is a radioactive isotope of iodine - an altered form of the element that is chemically the same as the naturally occurring element but is radioactive. I-131 is found in fallout from atmospheric nuclear bomb explosions, along with a variety of other radioactive substances such as strontium-90. I-131 has been of greatest concern because it concentrates in the thyroid, particularly in children, and may increase the risk for thyroid cancer. There appears to be little risk of thyroid cancer for people exposed to radiation as adults. Because iodine concentrates in the thyroid, high doses of I-131 are used to treat some types of benign thyroid disease as well as thyroid cancer. ...
'For most people, the greatest I-131 exposure came from drinking contaminated milk. I-131 fell on pastures, and cows ate the vegetation, contaminating their milk. People received smaller levels of exposure from breathing contaminated air and eating other contaminated dairy products, eggs, and leafy vegetables. ... Because I-131 has a short half-life, less than 1 percent remained 80 days after most nuclear tests. ...
'Thyroid cancer is relatively uncommon compared with other forms of cancer, accounting for 1.6 percent of all cancers diagnosed in the United States. An estimated 20,700 cases will be diagnosed in 2002. The number of new cases is about 16 times the number of deaths, which is estimated to be 1,300 for 2002. Thyroid cancer occurs more than twice as often in women as in men. The rate of new cancers (invasive) for 1999 - the most recent year available - was 10.4 per 100,000 women and 3.8 per 100,000 men. Thyroid cancer death rates for 1999 were 0.5 deaths per 100,000 women and 0.4 deaths per 100,000 men. The lifetime risk of invasive thyroid cancer is estimated at 0.82 percent (1 in 122) for women and 0.30 percent (1 in 333) for men. Thyroid cancer is also highly curable. The five-year relative survival rate is 96 percent.'
In short, America was prepared to take some risks during the 1950s in order to reduce other risks. The bigger risk by far was considered to be a nuclear war with Russia. In order to collect civil defence data, nuclear weapon trials on home soil resulted in small doses to a vast number of people across America. The individual risk to any single individual was tiny in comparison to dangers from natural background radiation. But when you expose a vast number of people to a small amount of radiation, cases of long term effects result. These have to be balanced against the risks of war from not testing. People often say that a nuclear war was never possible during the Cold War because nobody would have won. However, Russia had a different attitude from Western pacifists (despite often using anti-American propaganda which appealed to pacifist sentiments, 'disarm and surrender, and we promise we won't bomb you' stuff).
Dr Gordon M. Dunning, chief Health Physicist for at the U.S. Atomic Energy Commission for fallout safety during nuclear weapons tests, wrote in the June 1964 edition of Health Aspects of Nuclear Weapons Testing, page 13:
"In describing the therapeutic use of iodine 131 in the treatment of hyperthyroidism, the [U.S. National Academy of Sciences-National Research Council, Pathological Effects of Thyroid Irradiation, A Report of a Panel of Experts from the Committees on Biological Effects of Radiation, July 1962; revised version date December 1966 is AD0651181, which notes that for a given dose the thyroid damage due to X-rays is more severe than that due to iodine-131 because the X-rays are received at a higher dose rate in a matter of seconds, while the dose from iodine-131 is received at a lower rate, spread over several weeks] report stated: '... There is no evidence at hand, except for one doubtful case in a child, that any of the treatments for hyperthyroidism has produced a thyroid cancer, although doses have ranged from a few thousand rad (roentgens) upward ...'."
After that was published, there was an argument between Dr Dunning and an anti-nuclear information group, published in the September 1964 issue of the Bulletin of the Atomic Scientists, pages 29-30. Dunning, who had been in charge of public safety and iodine-131 monitoring during the 1950s, pointed out that a medical study that found that "one in 286 children exposed to 100 rads of throid radiation may develop thyroid cancer" and a 1961 Federal Radiation Council report that 150 rads "significantly increasd cancer rates" applied to therapeutic X-ray irradiation delivered at very high dose rates (X-rays over a period of seconds, unlike iodine-131 doses delivered spread over a period of weeks) which (quoting from U.S. National Academy of Sciences-National Research Council, Pathological Effects of Thyroid Irradiation, A Report of a Panel of Experts from the Committees on Biological Effects of Radiation, July 1962) "appear to be 5 to 15 times as effective as iodine 131 ... There is no evidence at hand, except for one doubtful case in a child, that any of the treatments for hyperthyroidism has produced a thyroid cancer, although doses have ranged from a few thousand rad upward. ..."
Dr Dunning added in his letter to the September 1964 issue of the Bulletin of the Atomic Scientists, pages 29 that (because iodine-131 is of course highly volatile and doesn't condense quickly on fast-falling large fallout particles, so it is fractionated i.e. severely depleted from local fallout near the test site, but enriched in the distant fallout far downwind): "... the highest annual levels of iodine-131 in milk ever reported by the U.S. Public Health Service Milk Monitoring Network were at Palmer, Alaska (October 1961 through September 1962) ... The iodine-131 fallout in Alaska was largely the result of the USSR tests i.e., not local fallout. Incidentally, the Russian tests also were the principal source of the cesium 137 fallout in Alaska ..."
The thyroid damage to the people of Rongelap 115 miles downwind of the 14.8 megatons CASTLE-BRAVO nuclear test in March 1954 was due to their consumption of water from a fallout contaminated open cistern which collected rainwater (and fallout). They took no precautions and as a result received massive doses (from not just iodine-131 but also the other shorter lived iodine nuclides) according to the dosimetry based on iodine-131 excretion in the report by Dr Edward T. Lessard, et al., Thyroid Absorbed Dose for People at Rongelap, Utirik, and Sifo on March 1, 1954, BNL-5188. The people on Rongelap received mean thyroid doses from ingested water of 2,100 rads, those at Sifo received 670 rads, and those at Utirik received 280 rads. Therefore, the fact that some of the people did get thyroid nodules from their massive thyroid doses was to be expected, and does not prove the existence of a risk below the observed thresholds for the relevant dose rates.
1957 U.S. Congressional Hearings on Fallout
U.S. Congressional Hearings before the Special Subcommittee on Radiation of the Joint Committee on Atomic Energy, The Nature of Radioactive Fallout and Its Effects on Man, 27 May - 3 June 1957. Some extracts from these 1957 hearings will be given below. Because all the people interviewed and cross-examined were engaged in actually measuring the fallout and predicting it during the nuclear tests, it is not obsolete. The data it contains for nuclear tests is relevant today, because nuclear test data is not exactly obsolete just because it was collected a half-century ago. It contains extensive scientific first-hand accounts of nuclear test fallout incidents in Nevada and at the Eniwetok Proving Grounds (Bikini and Eniwetok Atolls). All you have to remember is that some of dose-activity conversion factors, half-lives and such like have since been improved. They include extensive references to documents which were secret in 1957, but have since been declassified. I'll include links to online versions of these declassified documents as they are mentioned.
U.S. Congressional Hearings before the Special Subcommittee on Radiation of the Joint Committee on Atomic Energy, The Nature of Radioactive Fallout and Its Effects on Man, 27 May - 3 June 1957, pages 105-115:
Dr William W. Kellogg (born 1917), RAND Corporation:
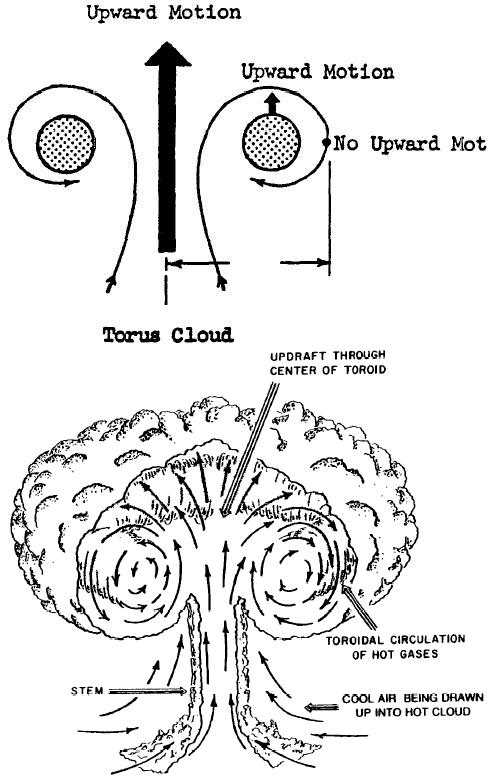
‘In the case of the surface burst, large quantities of surface material are broken up, melted, and even vaporized, and some of this material comes in intimate contact with the radioactive fission products. ... In the case of an air burst in which the white-hot fireball never reaches the surface, the radioactive fission products never come into close contact with the surface material; they remain as an exceedingly fine aerosol. At first sight this might be thought to be an oversimplification, since there have been many cases in which the fireball never touched the ground, but the surface material was observed to have been sucked up into the rising atomic cloud. Actually, however, in such cases a survey of the area has shown that there has been a negligible amount of radioactive material on the ground. Though tons of sand and dust may have been raised by the explosion, they apparently did not become contaminated by fission products.
‘The explanation for this curious fact probably lies in a detailed consideration of the way in which the surface material is sucked up into the fireball of an air burst. Within a few seconds from burst time, the circulation in the atomic fireball develops a toroidal form, with an updraft in the middle and downdraft around the outside. Most of the fission products are then confined to a doughnut-shaped region, and may be thought of as constituting a smoke ring. When the surface debris is carried into the fireball a few seconds after the detonation, it passes up along the axis of the cloud, through the middle, and can often be seen to cascade back down around the outside of the cloud. In its passage through the cloud, it has passed around the radioactive smoke ring but has never mixed with it. (Reference: Kellogg, W. W., R. R. Rapp, and S. M. Greenfield: Close-In Fallout, Journal of Meteorology, vol. 14, No. 1, pp. 1-8, 1957.) [Another contributory factor is that by the time the dust in the updraft stem eventually reaches the fireball, it has cooled below the solidification temperature of the fission products.]

 ‘There has not been a large number of surface shots in the United States test series, and most of these have been set off in the Pacific area ... a method of surveying the ocean to determine the distribution of the fallout was used which has given us some fairly complete and quantitative data on the pattern from some larger yield devices. (Reference: Van Lint, V. A. J., L. E. Killion, J. A. Chiment, and D. C. Campbell: Fallout Studies During Operation Redwing, Field Command, AFSWP, Operation Redwing Preliminary Report, ITR-1354, October 1956, Secret, R. D.) A reanalysis of the fraction of the debris which came down within the first few hundred miles from the various Operation Redwing surface shots by Tucker (Reference: Tucker, B. J.: Fraction of Redwing Radioactivity in Local Fallout, RAND Corp., Report in preparation, May 1957, Secret, R. D.) based on the ocean and atoll survey made jointly by the Scripps Institute of Oceanography, the Naval Radiological Defense Laboratory, the Evans Signal Laboratory, the New York Operations Office of the AEC, the Chemical Warfare Laboratories of the Army Chemical Centre, and the Air Force Special Weapons Centre, reveals that from a large yield surface burst about 85 percent falls down in roughly the first 24 hours: for a barge shot in the water of a lagoon the fraction is between 65 and 70 percent. [The original analysis gave figures of 50% for land surface bursts and 30% for water surface bursts but used an inaccurate dose rate-to-activity deposit conversion factor, and an inaccurate decay curve to extrapolate back from measurement time to 1 hour which did not include neutron induced activities.] According to Tucker, the accuracy of the estimates here is probably no better than 20 or 30 percent ...
‘... a fallout pattern which changed its direction during the later stages of the fallout is the March 1, 1954, Castle [-Bravo] shot … In this case, the fallout apparently started out in a direction east-northeast, but a continued veering of the wind caused it to curve more to the east and east-southeast, until one side of it lay across some neighboring atolls. A study of this event by Rand in which the fallout was computed with the shot-time wind alone, and then again with the variable (true) wind, shows clearly how the pattern must have curved as it progressed. (Reference: Greenfield, S. M., and R. R. Rapp: Fallout Computations and Castle-Bravo – A Case Study, Rand Corp., RM-1855, January 1957, secret, R. D.)
‘... It appears that there are some few radioactive particles which escape from the mushroom while it is rising and are left behind in the stem cloud, and these will, of course, find their way to the ground sooner ...
‘In order to demonstrate the time of arrival of radioactivity at points relatively close to ground zero, the Naval Radiological Defense Laboratory [WT-615, WT-915] and the Army Chemical Corps [WT-916] have designed equipment which records the fallout as a function of time. Though their respective instruments were designed independently, they both work on essentially the same principle: a small tray or container is uncovered for a certain period of time (say, 5 minutes), then covered again. Automatically the next sampler is uncovered for its sampling period, and so on. It should be mentioned that both sets of instruments remained closed for the first minute after shot time, to allow the shock wave to pass the sampling station [without depositing non-radioactive blast wind carried dust into the fallout collection trays, as occurred during the 1951 GREENHOUSE and JANGLE fallout sampling efforts when only a small percentage of the material collected in open trays near ground zero was actually radioactive fallout and the rest was blasted dust].
‘A large number of such fallout versus time measuremtnts were made at the time of the Castle shot 1 [BRAVO], and a few had been made earlier at the Ivy Mkie test by NRDL. When all the results using 5-minute sampling times (20 cases) are plotted up one is impressed, first of all, at the erratic nature of the results. This is probably due to the fact that the samples are made with small areas and small time intervals, and therefore do not give results which are entirely representative of the fallout at that location[WT-915].
‘The next thing which one notices about the results is that the majority of them show no fallout for the first 30 minutes; the average time of arrival for all stations which received any fallout was 28 minutes. These stations were located at distances from ground zero ranging from 8 to 30 miles. In visualizing these distances, recall that the Ivy Mike cloud had a radius at about 5 minutes of 10 miles, and at 10 minutes it was nearly twice this. For the Castle shot 1 the radius at 10 minutes was about 30 miles, and still growing. Thus, all the stations represented were literally in the shadow of the great mushroom cloud - though none were in the initial part of the stem.
‘The few stations which did apparently receive fallout earlier may have had something wrong with their mechanism (as would appear to be the case where two nearby stations give completely opposite results, or they were in a direction from ground zero which allowed them to be dusted by the material from the crater area which was born by the low level winds. This latter explanation appears to be reasonable, since we know that a certain small fraction of the radioactivity produced does reside in the stem cloud at relatively low altitudes.
‘It is therefore tempting to visualize the fallout as a slowly descending blanket, with a diameter roughly the diameter of the mushroom cloud. The blanket starts its fall as soon as the atomic cloud stabilizes (about 4 to 6 minutes after burst time) and touches the ground over a large area simultaneously. While this mushroom material undoubtedly represents the major fallout, some material from the stem may reach the ground sooner, and the direction of this immediate fallout from the stem would be determined by the mean wind in the lower levels, below, say, 20,000 feet.’

U.S. Congressional Hearings before the Special Subcommittee on Radiation of the Joint Committee on Atomic Energy, The Nature of Radioactive Fallout and Its Effects on Man, 27 May - 3 June 1957, pages 173-216:
Dr Gordon M. Dunning (born 1910), Pacific and Nevada tests fallout safety:
‘The relative biological effectiveness of differing energy photons and their varying depth-dose curves has been shown for X-rays. Similar results have been obtained for gamma rays as illustrated by one set of experiments using burros where there was a shift of the LD 50/30 values (lethal dose to 50 percent of the exposed animals who died in 30 days) from 684 roentgens with cobalt 60 (1.25 MeV mean energy) to 585 roentgens with Zr-95/Nb-95 (~0.7 MeV mean energy). ... The geometry of the source can make a significant difference in depth-dose curves and resultant biological effects. This may be illustrated by one experiment using swine where the LD 50/30 values for external dose decreased from 500 to 350-400 roentgens when the exposure was changed from unilateral to bilateral (the radiation exposure was first on one side only, then from opposite sides of the subject). ...
‘In the case of the Marshallese who were in the fallout from the [BRAVO] detonation at the Pacific on March 1, 1954, most of the more heavily exposed showed some degree of skin damage, as well as about half of them showing some degree of epilation [hair loss] due to beta doses. However, none of these effects were present except in those areas where the radioactive material was in contact with the skin, i.e., the scalp, neck, bend of the elbow, between and topside of the toes. No skin damage was observed where there was a covering of even a single layer of cotton clothing. ...
‘These findings indicate the obvious benefits to be expected from (a) remaining inside during the time of actual fallout to reduce the possibility of direct body contamination, or, if out of doors, to keep the body covered, and (b) early removal of the body contamination, since higher doses are delivered during early times after fallout [when the radiation level is highest].
‘The Marshallese were semi-clothed, had moist skin, and most of them were out-of-doors during the time of fallout. Some bathed during the two-day exposure period before evacuation, but others did not; therefore, they were optimal conditions for possible beta damage. The group suffering greatest exposure [Rongelap Islanders, who received 175 R of gamma exposure from 5-50 hours after detonation] showed 20 percent (13 individuals) with deep lesions; 70 percent (45 individuals) superficial lesions; and 10 percent (6 individuals) no lesions. Likewise, 55 percent (35 individuals) showed some degree of epilation followed by a regrowth of hair. ...
‘The principal hazards from intake [by food, milk and water] of relatively large amounts of radioactive fallout for several weeks immediately following a nuclear detonation are doses to the:
‘(a) gastrointestinal tract, from the gross fission product activity,
‘(b) thyroid, from isotopes of iodine, and
‘(c) bone, principally from isotopes of strontium and barium-lanthanum.
‘The solubility of the fallout material is a major factor in determining the resultant fate, and thus radiation doses, within the body. The solubility varies, depending among other factors upon the surface over which the detonation occurred. The fallout material collected in soil samples at the Nevada test site has been quite insoluble, i.e., only a few percent in distilled water and roughly 20 to 30 percent in 0.1 N HCl [eg, stomach acid]. However, it would be expected that the activity actually present in drinking water supplies would be principally in soluble form. The water collected from a well and a cistern on the island of Rongelap about 21 months after the March 1, 1954, fallout, was found to have about 80 percent of the activity in the filtrate ... Other data suggest the material to have been about 10 to 20 percent soluble in water. ... 90 percent of the material is insoluble (when calculating doses to the gastrointestinal tract) ... all of the isotopes of iodine are soluble (when calculating doses to the thyroid) ... 25 percent of the ingested strontium isotopes and 7 percent of the barium-lanthanum reached the bones. ...
‘In an area of heavy fallout one matter to consider is the relative hazards from the external gamma exposure versus internal doses from ingestion of the material. One of the best evidences on this point was the fallout that occurred on the Rongelapese in March 1954. Those in the highest exposure group received 175 roentgens whole body external gamma exposure yet their body burdens of internal emitters were relatively low. ...
‘Since 1951, the United States has conducted 11 series of nuclear tests, 5 at the Nevada test site and 6 at the Eniwetok Proving Ground, for a total of more than 63 test detonations. A sixth series is currently underway at the Nevada test site. The fallout on the inhabitants of some of the Marshall Islands in March 1954 (which will be discussed by others) and fallout on some Japanese fishermen, have been the major effects off the testing areas. The only other off-site damage has been in the United States where the blast wave has caused minor structural damage [broken shop windows in Las Vegas, and elsewhere] for which about $45,000 has been paid in claims, and fallout that occurred on some horses and cattle grazing within 20 miles of ground zero, causing skin burns for which about $15,000 was paid.
‘At the Eniwetok Proving Ground, where the larger devices are tested, the warning area covers nearly 400,000 square miles. This area is under constant surveillance during the time of testing both by surface ships and by aircraft. Starting 2 days prior to a detonation, the search is intensified in the sector of probable fallout. If any transient ship is located in the warning area, it is advised to leave and the detonation is delayed until it is clear.
‘Fully manned weather and fallout prediction units are an integral part of the task force conducting the tests. Since the larger detonations in the Pacific require additional information on the upper air, new types of high-altitude balloons and missiles are used. Nine weather stations are established by the task force during the test series on islands around the site, in addition to the eight regular weather stations in operation on other islands.
‘After each detonation, aircraft track the radioactive air out for several hundred miles. Other aircraft, with special monitoring equipment, fly over land and sea areas to measure any residual contamination.
‘Through the cooperation of the United States Public Health Service, trained monitors were present during Operation Redwing (spring 1956 series) on the populated islands of Wotho, Ujeland, and Utirik.
‘As would be expected, the delineation of fallout patterns in the wide expanses of the Pacific is difficult. For the immediate monitoring, aerial surveys are conducted as mentioned above, automatic equipment are placed on land areas, and a variety of ships, skiffs, and buoys are utilized. Following each test series, large-scale radiological and biological surveys are made. ...
‘The Nevada test site covers an area of about 600 square miles, with the adjacent 4,000 square miles being a United States Air Force gunnery range. Surrounding these areas are wide expanses of sparsely populated land. ... Each nuclear detonation is publicly announced ahead of time.
‘As part of the test organisation there is an advisory panel of experts in the fields of biology and medicine, blast, fallout prediction, and meteorology. A series of meetings is held before the firing of each shot to weigh carefully all factors related to the safety of the public.
‘A complete weather unit is in operation at the Nevada test site, drawing upon all of the extensive data available from the United States Weather Bureau and the Air Weather Service, plus six additional weather stations ringing the test site. These data are evaluated for the current and predicted trends ... A shot can be cancelled at any time up to a few seconds before the scheduled detonation. In the past, more than 80 postponements have been made due to unfavorable weather conditions.
‘Several measures have been made to reduce the radioactive fallout off the test site. First, of course, only small nuclear devices are tested at Nevada. Since the greater the height of the fireball above the surface the less is the fallout in nearby areas, the test towers have been extended to 500 feet, and during Operation Plumbbob (spring 1957) there will be at least one 700-foot tower. Also, a new technique of using captive balloons is being developed. Extensive tests are being conducted to determine the feasibility of detonating nuclear devices so far underground that all of the radioactive material will remain captured and thus, of course, completely eliminate any fallout.
‘Prior to each nuclear detonation a warning circle is established for aircraft, designed to provide control of aerial flights within the area of predicted path of the atomic cloud. ... This may typically extend about 150 miles in radius and be in force for a period from about H minus one-half hour to H plus 10 hours. All aircraft are required to check through the Civil Aeronautics Administration before flying in this area.
‘After each nuclear burst, aircraft from the test organization track the cloud until it is no longer readily detectable. Behind this come other aircraft to plot the fallout pattern on the ground. This survey is repeated on D plus 1 day. ...
‘... natural background radiation is roughly 4 roentgens per 30 years ... The average exposure to only those communities around the Nevada test site that experienced the greatest [annual] amount of fallout (0.2 roentgens or more) is 0.6 roentgens for the 6 years since the regular nuclear tests were started. The round numbers are 58,000 man-roentgens for 100,000 people. If the area considered around the Nevada test site is enlarged to include 1,000,000 people the average exposure is about 0.1 roentgens for the 6 years, or at a rate of about one-half roentgen per 30 years. This is one-twentieth of the recommendation of the National Committee on Radiation Protection and Measurements for maximum exposures.
‘The highest measured concentration of fission product activity in the air off the Nevada test site was at St. George, Utah, during the spring 1953 test series, amounting to about 1.3 microcuries per cubic meter of air averaged over a 24-hour period. It was estimated that the radiation dose to the lungs from this activity was less than that delivered every month by naturally occurring radioactive isotopes in the air that we breathe.
‘The highest measured concentration of activity from fallout material in water off the controlled area was at upper Pahranagat Lake, Nev., in the spring of 1955, amounting to 1.4 x 10⁻⁴ microcuries per millilitre at 3 days after the detonation. This is one-thirty-sixth of the operational guide – an amount that is considered safe for continuous consumption. ...
‘In the case of the Marshallese, it was very illuminating to note that even a single layer of cotton clothing was enough to prevent a serious beta dose to the skin, and where the fallout material did land on the skin and did remain there, such as in the folds of the neck and in the elbow, there were these so-called beta burns, burns of the skin from beta rays. Yet, where they had the light clothing on, there were no burns. Nor were there any on even the lower part of the leg, but there were on the feet where again the material had been scuffed up from the ground. ... The inhabitants of Rongelap Island were about 110 statute miles from the point of detonation. Some were evacuated at 36 hours, and some at about 48 hours after detonation. Upon evacuation, they took baths. Some of them did beforehand, and some of them not. It would appear that those who did take baths in the ocean did not get beta burns. It was merely a physical picture of moving the material from the body. [The Japanese fishermen on the Lucky Dragon were] somewhat closer than the Rongelapese. This fallout occurred on them, and they did not wash in general. Most of the dose was delivered in the first few days ...
‘One example of the effects of winds was observed during Upshot-Knothole. The fallout from the March 17, 1953, detonation was in a long narrow pattern to the east of ground zero. The second day after the fallout a rather strong surface wind blew almost at right angles across the area, for about a period of a day. Dose rate readings were taken on the first and fourth days at the same localities and then compared. The fourth day dose rates were less, by factors of 3 to 6, than those to be expected from the first day’s readings, based on rate of decay of t-1.2. (Other fallout measurements indicated that the rate of decay of this fallout material [in a laboratory, in isolation from the wind dispersal mechanism] was not significantly different from t-1.2.) ...
‘The highest whole-body gamma dose recorded for any locality where personnel were present outside the Nevada test site was at Riverside Cabins, Nevada (about 15 people), following shot No. 7 of Upshot-Knothole. The maximum theoretical [t-1.2 calculation] infinity dose was estimated to be 12 to 15 roentgens.’
Pages 944-948:
Dr Eugene P. Cronkite (born 1914), author of TID-5358 (online versions of that report here and here), nuclear test project officer in charge of the medical care of the Marshallese contaminated by heavy fallout (64 Rongelap islanders received 175 R of gamma exposure plus much higher surface skin doses from beta fallout on the skin) after the 1954 Castle-Bravo test:
‘The fallout material consisted predominantly of flakes of calcium oxide resulting from the incineration of the coral [reef near Namu Island at Bikini Atoll]. Upon the flakes of calcium oxide fission products were deposited. At Rongelap Atoll the material was visible and described as snowlike. ... To arrive at some physical estimate of the skin dose, an attempt must be made to add up the contributions of the penetrating gamma, the less penetrating gamma, the beta bath to which the individuals were exposed from the relatively uniform deposition of fission products in the environment, and the point contact source of fallout material deposited on the skin. By all means, the largest component of skin irradiation resulted from the spotty local deposits of fallout material on deposited surfaces of the body.
‘To put it in reverse, the individuals who remained inside had no skin burn. It was only on those on whom the material was directly deposited on the skin that received burns. ...
‘Itching and burning of the skin occurred in 28 percent of the people on Rongelap, 20 percent of the group on Ailinginae, and 5 percent of the Americans [weather station staff exposed to fallout on Rongerik Atoll]. There were no symptoms referable to the skin in the individuals on Utirik. In addition to the itching of the skin there was burning of the eyes and lacrimation in people on Rongelap and Ailinginae. It is probable that these initial skin symptoms were due to irradiation since all individuals who experienced the initial symptoms later developed unquestioned radiation-induced skin lesions that will be described later in detail. It is possible, however, that the intensely alkaline nature of the calcium oxide when dissolved in perspiration might have contributed to the initial symptoms.
‘About two-thirds of the Rongelap group were nauseated during the first 2 days, and one-tenth vomited and had diarrhea. One person in the Ailinginae group was nauseated. No one in the Rongerik or Utirik group, or Americans, had gastrointestinal symptoms. Between the 33rd and 43rd post exposure day, 10 percent of the individuals from Rongelap had an absolute granulocyte level of 1,000 per cubic millimetre or less. The lowest count during this period was 700 per cubic millimetre. ... The normal count would be approximately 5,000 to 6,000 in American population. ... [On page 946, Dr Cronkite adds that in eleven individuals the platelet count dropped to 35,000-65,000 per cubic millimetre, without causing hemorrhages.] During this interval the advisability of prophylactic administration of antibiotics was seriously considered. However, prophylactic administration of antibiotics was not instituted for the following reasons:
‘(1) All individuals were under continuous medical observation so that infection, if it developed, would have been discovered in its earlier stages.
‘(2) Premature administration of antibiotics might have obscured medical indications for treatment, and might also have led to the development of drum resistant organisms in individuals with lowered resistance to bacterial infection.
‘(3) There was no accurate knowledge of the number of granulocytes required by man to prevent infection with this type of granuloctyopenia as occurred in the Marshallese. ...
‘The few individuals that received antibiotics had conditions that would have been treated with antibiotics in the absence of any previous exposure to radiation. During the fourth and fifth exposure weeks an epidemic of upper respiratory infection occurred [colds]. … It was of interest to determine whether this respiratory infection could be correlated with the dose of radiation received or changes in the leukocyte count. There was no correlation. The respiratory infection in the medical personnel involved in the care and study of the irradiated individuals was similar in incidence and severity. …
‘On first examination by the medical team on the ninth post exposure day the exposed people appeared to be in good health and the skin was definitely normal in external appearance. Evidence for the development of skin lesions commenced approximately 2 weeks after exposure.
‘During the early stages of development of the lesions, itching, burning and slight pain were experienced with the more superficial lesions. With deeper lesions the pain was more severe. The deeper foot lesions were the most painful and caused some of the people to walk on their heels for several days during the acute stages. Some of the more severe lesions of the neck and axillae were painful. There were no constitutional symptoms associated with the skin lesions.
‘The characteristic sequence of events in the development of the lesions was the occurrence of symptoms, then of black pigmented areas, small in size, which grew larger in size and coalesced. Later the skin began to shed from the inside of the pigmented plaques to the outside, and in some cases resulted in the production of large depigmented areas. In most of the lesions the shedding was limited to the superficial layers of the skin. In some the process continued with the development of superficial ulcers. A few became infected. ...
‘In addition to the skin burns, loss of hair, spotty in nature, occurred in some of the individuals. The hair grew in again with normal color and texture and the regrowth was complete in all except possibly one middle-aged man in whom it came in somewhat sparsely. … Some of the skin burns became infected, particularly those on the feet, and were treated locally by cleansing and applications of antibiotic ointments. The skin burns healed in most cases with return of normal color and texture of the skin, and in some cases scars were left with depigmented areas. …
‘Certain lessons were learned from the Marshallese experience.
‘Burns were caused by direct contact of the radioactive material with the skin. The perspiration as common in the tropics, the delay in decontamination and the difficulties in decontamination certainly favored the development of the skin burns. Those individuals who remained indoors or under trees during the fallout developed less severe skin burns. The children who went wading in the ocean developed fewer lesions of the feet and most of the Americans who were more aware of the dangers of the fallout, took shelter in aluminum buildings and bathed and changed clothes. Consequently they developed only very mild beta burns.
‘Lastly, a single layer of cotton material offered almost complete protection, as was demonstrated by the fact that skin burns developed almost entirely on the exposed parts of the body.’
Pages 258-260:
‘Statement of United States Naval Radiological Defense Laboratory (NRDL): Prediction of Fallout
[by Edward A. Schuert (b. 1923) and Charles F. Ksanda (b. 1921); see pages 321-3]
‘It was realised after the early weapons test operations that there existed a requirement for predicting the then little understood phenomenon of fallout. NRDL made the first studies on this subject by employing scaling techniques (1, 2, 3) similar to the approach used in the determination of blast and thermal effects for weapons over a wide range of yields. Such scaling of radiological phenomena resulted in satisfactory results when compared to the meagre experimentally determined field data (4). As more effects data became available from subsequent weapons test operations (5, 6, 7, 8) the limitations of a straightforward scaling technique were observed and the increasing dependence of the fallout on the dynamical parameters involved, such as the meteorological variables, became apparent. This led to the development of a physical model that would hopefully explain the mechanism of fallout such that, given the required input parameters, a knowledge of the fallout phenomenology for any type of nuclear detonation could be predicted (2, 9, 10). This model development was initiated by concentrating the effort on surface land detonations. Very little factual data were available for construction of such a model. However, it was realised that this approach offered the most positive chance of success and consequently theoretical assumptions regarding the model input parameters would have to be made. This model then defined the cloud source and associated parameters such as particle size distribution and relation of activity to particle size. A mechanism theory based on the particle settling rates and the effect of the winds aloft in determining the trajectories of these particles was established. A mathematical technique of summing the deposited activity on the earth’s surface was developed such that the fallout pattern would then be established.
‘Because of the many initial assumptions made, a great deal of effort was taken in subsequent nuclear weapons test operations to obtain refinements of these parameters by measurement (2). This work included detailed physical, chemical and radiochemical analyses of fallout particles, time dependent studies on the fallout such as time of arrival as a function of distance, rate of arrival, and time to peak activity. Activity levels as a function of distance were made (5, 6, 7). Rockets were employed to establish the radioactivity profiles within the mushroom cloud (11). Such experimental data were employed in the refinement of the physical model, as well as were detailed studies of the effect of time and space variation of the winds aloft on the trajectories of the fallout particles. This data greatly improved the ability of the model to predict the fallout and continuing refinements are being made. The use of a physical model for understanding and predicting fallout appears justified (12).
‘A fallout forecasting technique has been developed to satisfy the immediate needs of the military. This technique employs many of the model parameters established. However, it was designed for operational use and predicts only the perimeter of the fallout pattern and the radiological axis of the area or "hot line" (13, 14). It is a rapid system that was tested at Operation Redwing and proved very satisfactory for both surface land and surface water detonations. The details of this technique are described in the enclosed NRDL Technical Reports TR-127 and TR-139.
‘There has not been developed a satisfactory physical model for underwater or underground detonations to date. For these cases, and environmental conditions other than surface or near surface burst, the use of scaling techniques holds the most promise. However it is not inconceivable that the mechanism of such detonations will be understood and subsequent models developed.
‘The accuracy of prediction of fallout is very dependent on the quality of the meteorological data available. With precise meteorological data the area of fallout and direction of the axis of the pattern can be excellently forecast. The quantitative prediction of radiation levels at any point within the fallout area is much more difficult to predict.
‘It is considered essential, in order to insure the application of fallout prediction technique and radiological hazard assessment to a wide variety of detonation conditions, that the basic mechanisms responsible for formation of fallout, movement of fallout material in atomic clouds, its dispersal by meteorological forces and return to the earth’s surface be thoroughly understood. Only a beginning to develop such an organised set of scientific data has been made.’
‘REFERENCES
‘1. Scaling of Contamination Patterns, Surface and Underground Detonations by C. F. Ksanda et al, USNRDL TR-1, September 15, 1953 (secret RD).
‘2. Proceedings of the AFSWP Fallout Symposium, AFSWP 895, January 1955 (secret RD).
‘3. Comparisons of Methods Used in Scaling Residual Contamination Patterns, by Boyd and Baker, AFSWC-TN-56-1, Kirkland AFB (secret RD).
‘4. Fallout Studies, Project 2.5a-2 Operation JANGLE, by I. Popoff, et al. WT-395 (secret RD).
‘5. Nature, Intensity, and Distribution of Fallout from Mike Shot, Project 5.4a, Operation IVY, WT-615 by W. B. Heidt, Jr., et al. April 1953 (secret RD).
‘6. Distribution and Intensity of Fallout, Project 2.5a, Operation CASTLE, WT-915 by R. L. Stetson, et al. January 1955 (secret RD).
‘7. Characterization of Fallout, Operation REDWING Project 2.63, ITR-1317 by T. Triffet, et al., April 1957 (secret RD).
‘8. Fallout Studies During Operation REDWING, program 2 summary, ITR-1354 by A. J. Van Lint, Victor, et al. October 1956 (secret RD).
‘9. Spheroidal Cloud Theory by J. M. McCampbell, NRDL TM-11 September 1954 (secret RD).
‘10. Theory of Fallout by J. M. McCampbell, NRDL TR, in preparation (secret RD).
‘11. Rocket Determination of Activity Distribution Within the Stabilized Cloud, by R. R. Soule, E. C. Guilford, ITR 1315 (secret RD).
‘12. Proceedings of the Rand Sympopsium on Fallout 1957, unpublished (secret RD).
‘13. A Fallout Forecasting Technique with Results Obtained at the Eniwetok Proving Ground, USNRDL Technical Report 139, May 1957 (unclassified) by Edward A. Schuert.
‘14. A Fallout Plotting Device, by E. A. Schuert, USNRDL Technical Report 127, February 1957 (unclassified).
‘15. Fallout Phenomenology, Annex 6.4, Scientific Directors Report, Operation GREENHOUSE by Charles E. Adams, WT-4 August 1951 (secret RD).
‘16. Employment of Time and Space Variable Winds, Including Vertical Predictions, on the Analysis of Particle Trajectories by E. A. Schuert. USNRDL Report R. and L. Series, unpublished (confidential).
‘17. A Theory of Close-In Fallout, by A. D. Anderson, in preparation (secret RD).
‘18. The Use of Winds for Finding Seasonal Fallout Patterns, by A. D. Anderson July 27, 1956.
‘19. A New Wind-Measuring System for Tactical Fallout Prediction by A. D. Anderson, W. E. Strope, May 13, 1957 (unclassified).
‘20. A Proposed Rocket-Radar System for Measuring Winds up to 200,000 Feet by A. D. Anderson, June 13, 1956 (unclassified).’
Pages 260-262:
‘Statement of United States Naval Radiological Defense Laboratory (NRDL): Measurement of Fallout
[by Terry Triffet (b. 1922); see pages 321-3]
‘It has been the overall objective of the fallout measurements made by NRDL at the Nevada test site (2-4, 9-11) and the Eniwetok Proving Grounds (1, 5-8, 12) to obtain those data which would allow prediction techniques to be tested and assessment methods developed for the radiological situations resulting from a wide range of nuclear detonation conditions (8).
‘Since fallout predictions result in the construction of gamma intensity contours, one group of measurements has featured the collection of experimental data for such contours. Direct measurement of the gamma ionisation rate at a large number of points in the fallout area with a hand survey meter is the simplest and in many ways the most satisfactory method of obtaining this type of information (2, 4). When the fallout has been deposited on a solid surface, as in Nevada, surveys of this type have generally been used and further supplemented with measurements on instruments calibrated in terms of ionisation of the activities of samples collected at certain locations for the primary purpose of physical, chemical, and radiochemical studies. When the fallout has been deposited on a water surface, as in the Pacific, certain other measurements are required for the interpretation of survey results.
‘Because of the way in which the fallout material settles and disperses in the water, it has been necessary to measure its distribution to the total depth of mixing at each point of measurement before the total fallout deposited at that point could be computed. This has been accomplished in part by the use of a radiation sensitive probe which could be lowered to various depths, and in part by measuring the activities of samples collected at various depths. Both procedures have required critical instrument calibrations and theoretical work involving a number of assumptions, however, and it is probable that the results are much less accurate than those for the land surface case. In general, the measurements of this kind made by NRDL have shown that areas of the order of tens of square miles are subjected at early times to ionisation intensities greater than 5 r/hr by events in the low kiloton range and areas of the order of thousands of square miles to ionisation intensities greater than 5 r/hr by events in the megaton range. Levels of several thousand r/hr at early times for both yield ranges have been measured or inferred, although less than 10 percent of the total affected area was estimated to have experienced these levels. While the probable error for contours from survey ionisation rate measurements has been estimated ± 20 percent for Nevada kiloton events, corresponding land equivalent contours for megaton events in the Pacific cannot be estimated closer than within a factor of 2 or 3 at the present time.
‘Another group of measurements has been directed toward obtaining time dependent data, such the variation of the gamma field intensity and gamma energy spectrum with time and the distribution of particle sizes deposited with time at a number of locations in the fallout area (10, 12). Such information is needed both to check model theory, which yields similar results, and to provide a complete description of fallout phenomena. The changing gamma radiation field has usually been measured by means of an instrument which recorded increments of ionization dose received at its location from all sources within unit time intervals, while gamma energy spectra have been measured on fallout samples from a known fallout area with an instrument utilizing a crystal detector, a photomultiplier and a pulse height discriminator (7, 12). NRDL results have shown that the gamma radiation field due to fallout outside the area of severe blast damage tends to build up to a maximum in approximately twice the time required for the fallout to arrive, varying from a few minutes near ground zero to 24 hours or more at distances of over 100 miles. The radioactive decay of fission products may be approximated by a straight line of slope –1.2 on a log-log plot; however the more general case in which several induced activities are present, and the fission products are fractionated, leads to a complex decay curve. Spectral measurements show the average energy of the fallout gamma radiations to vary from about 0.6 MeV at 10 hours to 0.3 MeV at 360 hours.
‘The determination of particle size distributions with time has required the development and application of specialized collectors capable of sampling automatically over consecutive time intervals from a few minutes to an hour or more, as well as special methods and instruments for sizing and counting the collected particles. It has been found that particles with diameters between 100 and 300 microns predominate in most collections with larger sizes (2,000-3,000 microns) increasing nearer ground zero and smaller sizes (20-200 microns) increasing farther away from ground zero. In general, data of this kind, being more direct, are more reliable for computing fraction of the bomb in the total fallout than survey results – although several sources of error such as sample bias (11) and radionuclide fractionation, do exist. On the scale utilized above, standard error in fraction calculations might be estimated at about ± 25 percent for the gamma energy and emission rate method, as opposed to possibly several hundred percent by the survey method for water surfaces and than 100 percent for land surfaces.
‘Extensive physical, chemical, and radiochemical analyses have been performed on the particulate produced by detonations occurring on the sandy Nevada soil and on coral atolls and the ocean surface in the Pacific. The mass of such material as well as the fraction of the bomb deposited per unit area at a number of locations has also been determined by weighing collected samples and performing radiochemical analyses. Since fallout ingestion constitutes a separate hazard from exposure to external fallout radiation, and since countermeasures and recovery procedures depend heavily on knowledge of the various properties of the contaminant, information of this kind is essential for assessment purposes.
‘NRDL has consistently emphasised measurements of local fallout and characterization of the phenomena associated with it. It has been possible, nevertheless, to estimate the fraction available for worldwide fallout by subtraction of the local fallout from the total produced, and this has been found to be something of the order of 50 percent for both land surface and water surface events. No closer estimate can be given because of the many uncertainties and sources of possible error in the measurements and calculations.
‘REFERENCES
‘Greenhouse
‘1. Adams, C. E., Holden, F. R., Wallace, N. R., Fallout Phenomenology, Operation Greenhouse scientific directors report annex 6.4, WT-4, August 1951 (secret R. D.)
‘Jangle
‘2. Johnson, G. W., Monitor Survey of Ground Contamination, Operation Jangle, project 2.1d, may 1952 (confidential, security information).
‘3. Poppoff, I. G., et al., Fallout Particle Studies, Operation Jangle, project 2.5a-2, WT-395, April 1952 (secret R. D.).
‘4. Laurino, R. K., Poppoff, I. G., Contamination Patterns at Operation Jangle, USNRDL-399, April 1955 (secret R. D.).
‘Ivy
‘5. Heidt, W. B., et al., Nature, Intensity and Distribution of Fallout From Mike Shot, Operation Ivy, project 5.4a, WT-615, April 1953 (secret R. D.).
‘Castle
‘6. Stetson, R. L., et al., Distribution and Intensity of Fallout at Operation Castle, project 2.5a, WT-915 (secret R. D.).
‘7. Cook, C. S., et al., Gamma Ray Spectral Measurements of Fallout Samples from Operation Castle, USNRDL-TR-32 (AFSWP-822) January 1955 (confidential).
‘Wigwam
‘8. French, F. A., Fallout and Airborne Activity in Operation Wigwam, with Notes on Surface Effects, project 2.7, WT-1017, May 1955 (confidential).
‘Teapot
‘9. Stetson, R. L., Shirasawa, T. H., Distribution and Intensity of Fallout from the Underground Shot, Operation Teapot, project 2.5.2, ITR-1154, May 1956 (secret, R. D.).
‘10. Webb, L. A., et al., Analysis of Gamma Radiation from Fallout from Operation Teapot, USNRDL-TR-106, August 1956 (confidential).
‘11. Sandomire, M. M. Teapot Fallout Sampling Studies, memorandum dated December 1955 (unclassified).
‘Redwing
‘12. Triffet, T., LaRiviere, P. D., et al., Characterization of Fallout, ITR-1317, April 1957 (secret R. D.).
‘General
‘13. Fallout symposium sponsored by AFSWP, AFSWP-895, January 1955 (secret R. D.)
‘14. Fallout symposium sponsored by RAND, March 1957, proceedings in publication (secret R. D.).’
There are previous posts on this blog which review fallout data here, here, and here.