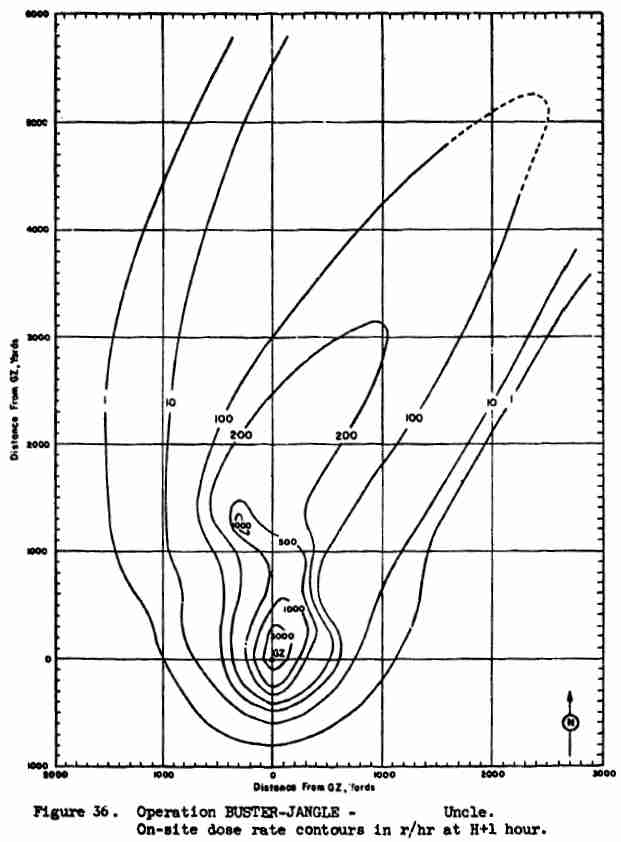
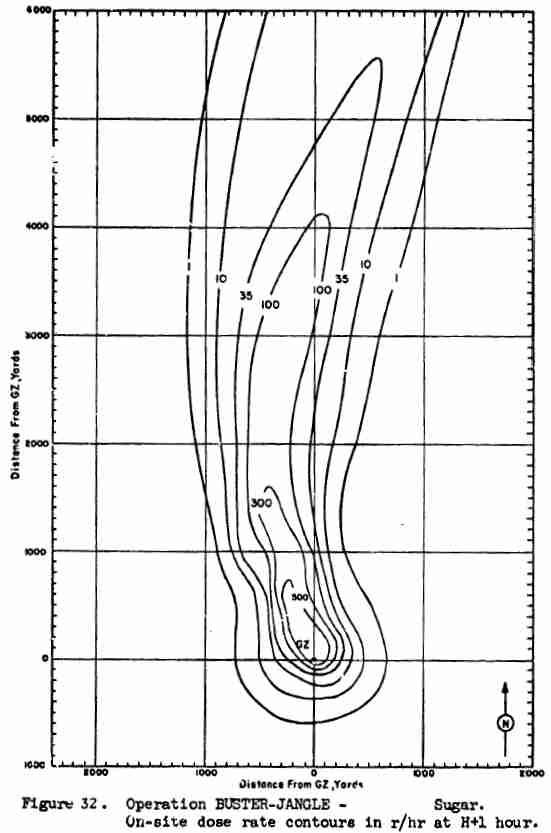
 ABOVE: fallout from Sugar, a 1.2 kiloton surface burst in the Nevada on 19 November 1951, illustrating the very limited range of the major residual radioactivity threat from a terrorist nuclear detonation in a city. (Mean wind speed between surface and top of cloud was 46 km/hour.) People can walk away and save their lives because the fallout in danger areas was highly visible (more about this later) and you can see it and walk out of the contaminated area without waiting to get a fatal radiation dose. After deposition, the fallout dose rises gradually over hours and days. The fallout brushes or washes off clothes and skin, which averts the risk of beta burns. The Sugar crater (90 feet wide, 21 feet deep) trapped a lot of activity and was highly contaminated (7,500 R/hr at the crater lip at 1 hour after burst), but the contamination downwind could be avoided by simply walking to the edge of the fallout area. The highest intensity fallout contour is 500 R/hr. These hard-won civil defence facts seem to be ignored in modern planning.
'With the National Academy of Sciences reaffirming its faith in the linear no-threshold dogma ... the U.S. government is continuing its policy of “protecting” Americans with extremely costly measures against non-threats–while leaving them totally vulnerable to the really big threats.'
The fallout pattern for a 1-kiloton near surface burst is very small, and the fallout is deposited in massive visible particles where the dose rate is dangerous. See Dr Carl F. Miller, USNRDL-466 page 17 for the mass deposit of fallout associated with 1.2 kt Nevada surface burst S-shot and underground or Uncle U-shot, 1951. Fallout patterns from 1 kiloton surface bursts and shallow buried bursts show that the serious fallout radiation hazards occur a few hundred metres around ground zero upwind and a few kilometres downwind, so people seeing fallout can simply walk away as the time to do so is short compared to the time taken to accumulate a serious dose.
Under the Chair of Janet K. Benini, Director of Response and Planning, White House Homeland Security Council, a replacement for the 1977 Cold War classic civil defence planning data book by Glasstone and Dolan (The Effects of Nuclear Weapons, discussed earlier on this blog) has now been released. It is 164 pages long, unclassified, and is called National Planning Scenarios. (Update: the original link I had to a 164 pages book dated February 2006 no longer works as it has been removed from the official site where it was located. Hence I've changed the link to an older 157 pages copy dated April 2005 and hosted by the Washington Post.)
It updates some of the data in Glasstone and Dolan for general blast and radiation effects, but in doing so it focusses on a terrorist 10 kiloton U235 gun type surface burst. It extracts more up-to-date information from more recent sources including revisions of Capabilities of Nuclear Weapons Effects Manual EM-1. Unlike Glasstone and Dolan, although it begins with nuclear threat effects, it then deals with a wide range of biological and chemical weapons attacks and their effects.
Two supplementary manuals are also being released, Attack Timelines (February 2006) and Universal Adversary Group Profiles. Of these supplements, so far only the 112 pages long Attack Timelines is available, at least in unclassified form. The draft versions so far available, while unclassified (containing no sensitive or secret data), are marked official use only, and presumably changes may be made before final versions are published.
To give an idea of the scope of National Planning Scenarios, the frontspiece and contents are:
Version 21.2 DRAFT
NATIONAL PLANNING SCENARIOS
Created for Use in National, Federal, State, and Local Homeland Security Preparedness Activities
February 2006
White House Homeland Security Council
Contents
Introduction.... ii
Scenario 1: Nuclear Detonation – 10-kiloton Improvised Nuclear Device .... 1-1
Scenario 2: Biological Attack – Aerosol Anthrax .... 2-1
Scenario 3: Biological Disease Outbreak – Pandemic Influenza.... 3-1
Scenario 4: Biological Attack – Plague .... 4-1
Scenario 5: Chemical Attack – Blister Agent .... 5-1
Scenario 6: Chemical Attack – Toxic Industrial Chemicals.... 6-1
Scenario 7: Chemical Attack – Nerve Agent.... 7-1
Scenario 8: Chemical Attack – Chlorine Tank Explosion .... 8-1
Scenario 9: Natural Disaster – Major Earthquake .... 9-1
Scenario 10: Natural Disaster – Major Hurricane.... 10-1
Scenario 11: Radiological Attack – Radiological Dispersal Devices.... 11-1
Scenario 12: Explosives Attack – Bombing Using Improvised Explosive Devices.... 12-1
Scenario 13: Biological Attack – Food Contamination .... 13-1
Scenario 14: Biological Attack – Foreign Animal Disease (Foot-and-Mouth Disease).... 14-1
Scenario 15: Cyber Attack .... 15-1
Appendix: Scenario Working Group Members .... A-1
One issue is that it ignores the effects of EMP from high altitude bursts using a terrorist missile-launched warhead, and the base surge and hard-to-remove ionic contamination from a shallow underwater burst, like Britain's Hurricane ship-burst nuclear test in 1952. If someone is able to smuggle a nuclear warhead in aboard a ship, they might very well just detonate it off shore beside a city when the wind is blowing inland.
George R. Stanbury of the British Home Office Scientific Advisory Branch attended the Hurricane nuclear test at Monte Bello in 1952 and a year later wrote Restricted level reports showing the effects of a terrorist attack with nuclear bombs in a ship near Liverpool, without mentioning that the fallout pattern used was based directly on the Top Secret results of Hurricane shot (HO225/42, 1953: Estimates, for exercise purposes, of the radioactive contamination of land areas from an adjacent underwater explosion, and HO225/51, 1954: Assumed effects of two atomic bomb explosions in shallow water off the port of Liverpool) . The residual radioactivity was very severe. The declassified American manual on underwater explosions ignores the data: mainly because of some data American which showed little residual contamination.
Page ii the new civil defence book states:
'The Federal interagency community has developed 15 all-hazards planning scenarios (the National Planning Scenarios or Scenarios) for use in national, Federal, State, and local homeland security preparedness activities. The Scenarios are planning tools and are representative of the range of potential terrorist attacks and natural disasters and the related impacts that face our nation. The objective was to develop a minimum number of credible scenarios in order to establish the range of response requirements to facilitatepreparedness planning. Since these Scenarios were compiled to be the minimum number necessary to develop the range of response capabilities and resources, other hazards were inevitably omitted. Examples of other potentially high-impact events include nuclear power plant incidents, industrial and transportation accidents, and frequently occurring natural disasters. Entities at all levels of government can use the National Planning Scenarios as a reference to help them identify the potential scope, magnitude, and complexity of potential major events. Entities are not precluded from developing their own scenarios to supplement theNational Planning Scenarios. These Scenarios reflect a rigorous analytical effort by Federal homeland security experts, with reviews by State and local homeland security representatives. However, it is recognized that refinement and revision over time will be necessary to ensure the Scenarios remain accurate, represent the evolving all-hazards threat picture, and embod ythe capabilities necessary to respond to domestic incidents.
'How to Use the National Planning Scenarios:
'Capabilities-Based Planning –In seeking to prepare the Nation for terrorist attacks, major disasters, and other emergencies, it is impossible to maintain the highest level of preparedness for all possibilities all of the time. Given limited resources, managing the risk posed by majorevents is imperative. In an atmosphere of changing and evolving threat, it is vital to build flexible capabilities that will enable the Nation, as a whole, to prevent, respond to, and recover from a range of major events. To address this challenge, the Department of Homeland Security (DHS) employs a capabilities-based planning process that occurs under uncertainty to identify capabilities suitable for a wide range of challenges and circumstances, while working within an economic framework that necessitates prioritization and choice. As a first step in the capabilities-based planning process, the Scenarios, while not exhaustive, provide an illustration of the potential threats for which we must be prepared. The Scenarios were designed to be broadly applicable; they generally do not specify a geographic location, and the impacts are meant to be scalable for a variety of population and geographic considerations.'
The first scenario is:
'Scenario 1: Nuclear Detonation –10-kiloton Improvised Nuclear Device
'Scenario Overview: General Description –
'In this scenario, terrorist members of the Universal Adversary (UA) group—represented by two radical Sunni groups: the core group El-Zahir (EZ) and the affiliated group Al Munsha’a Al Islamia (AMAI)—plan to assemble a gun-type nuclear device using Highly Enriched Uranium (HEU) stolen from a nuclear facility located in Pakistan. The nuclear device components will be smuggled into the United States. The device will be assembled near a major metropolitan center. Using a delivery van, terrorists plan to transport the device to the business district of a large city and detonate it.
'Detailed Attack Scenario –
'Current intelligence suggests that EZ may be working with AMAI to develop an Improvised Nuclear Device (IND). It is suspected that special training camps in theMiddle East have been established for IND training. Some IND manuals have also been confiscated from suspected EZ operatives. The volume of communications between EZ and AMAI operatives has increased significantly in past two weeks. EZ operatives have spent 10 years acquiring small amounts of HEU. Operatives acquired the material by posing as legitimate businessmen and by using ties to ideologically sympathetic Pakistani nuclear scientists. EZ plans to construct a simple gun-type nuclear device and detonate the weapon at a symbolic American location. EZ Central Command initiates the operation. To preserve operational effectiveness at all levels, compartmentalization and secrecy are required. Due to fears of penetration, EZ has become increasingly discreet in its decision-making process, with few operatives informed of the next target. Target selection, preparation, and acquisition are confined to a small number of terrorist operatives.'
page 1-2:
'This scenario postulates a 10-kiloton nuclear detonation in a large metropolitan area. The effects of the damage from the blast, thermal radiation, prompt radiation, and the subsequent radioactive fallout have been calculated (based on a detonation in Washington, DC), and the details are presented in Appendix 1-A. However, the calculation is general enough that most major cities in the United States can besubstituted in a relatively straightforward manner. Enough information is presented in the appendix to allow for this kind of extrapolation. The radioactive plume track depends strongly on the local wind patterns and other weather conditions. In a situation where the wind direction cycles on a regular basis or other wind anomalies are present, caution should be exercised in directly using the fallout contours presented in the appendix. If the incident happened near the U.S. border, there would be a need for cooperation between the two border governments. Additionally, the IND attack may warrant the closure of U.S. borders for some period of time. If the detonation occurs in a coastal city, the fallout plume may be carried out over the water, causing a subsequent reduction in casualties. On the other hand, the surrounding water will likely restrict the zones that are suitable for evacuation. Bridges and tunnels that generally accompany coastal cities will restrict the evacuation, causing delay and an increase in the radioactive dose that evacuees receive. This delay may be substantial, and the resulting dose increase maydrive a decision to shelter-in-place or evacuate-in-stages. This assumes that the authorities have an effective communication channel with the public.'
The nuclear weapon effects section of this new civil defence planning guide was 'Prepared by the Department of Energy (DOE)/National Nuclear Security Administration (NNSA) Office of Emergency Response and Sandia National Laboratory' (chapter 1 page 12, or '1-12').
Despite the fact that they are assuming a 10 kiloton surface burst, they manage to calculate far more casualties than occurred at Hiroshima or at Nagasaki, which had higher yields. This arises because of fallout calculations. The absurdity of the whole thing is just crazy. The lethal fallout pattern for the 10 kiloton weapon is a couple of miles wide.
You can actually walk to safety in about a quarter of an hour, by walking cross-wind. How? Well you see flash and mushroom cloud stem direction even if there is cloud cover blocking out your view of the top of it, and if you then get a dust arriving you know you are downwind. You then walk crosswind (neither towards not away from the explosion) for about fifteen minutes, until you arrive at a location which isn't covered with avisible film of heavy fallout.
People can see lethal concentrations of fallout because it only arrives rapidly from the high mushroom and produces a danger if it falls fast, so it is large particles: see major fallout reports by Miller here and by Triffet and LaRiviere here.
‘Perhaps the most important application of radiological warfare would be its psychological effect as a mystery weapon, analogous to the initial use of poison gas and of tanks in World War I. The obvious method to combat radiological warfare in this case is to understand and be prepared for it.’ – Dr Samuel Glasstone, Editor, The Effects of Atomic Weapons, Los Alamos Scientific Laboratory, September 1950, p. 289.
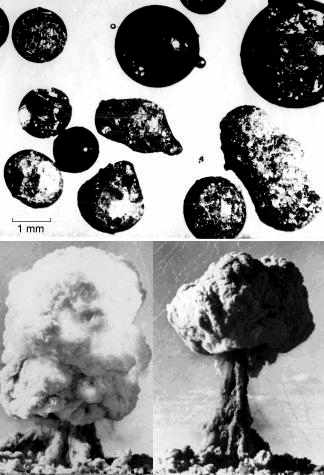
The fallout photo above was secret during the Cold War but has been declassified in the Atomic Weapons Research Establishment report by D.H. Peirson, et al, report AWRE-T28/57, 1957, page 26. Crown Copyright Reserved.
The photos of the mushroom cloud are for the same detonation that created the fallout particles: Buffalo-1. The photos were taken at 8 and 20 seconds after detonation of the 15 kiloton bomb on a 30 metre high tower, Maralinga, 27 September 1956.
The fallout consists of a mixture of large, smooth, globular, glossy, spherical particles resulting from the solidification of melted silicate sand with molten aluminium oxide from the tower, and a variety of unmelted, irregular sand grains. You can hear fallout hitting surfaces and bouncing off. You can also see, touch, and feel them, but you will not smell them (because of gravity, the fallout particles do not tend to enter your nose!). The melted particles are contaminated with insoluble activity trapped throughout their fused volume. Contamination on unmelted particles is limited to the surface, but is relatively soluble.
America also determined that lethal fallout concentrations are visible. If the fallout is on particles so small they can't be seen, the time taken for fallout ensures that the radiation decays to tolerable levels before that occurs. Obviously you have to be wary of rain for several hours after a nuclear explosion, as it can wash fallout out of the atmosphere, but again rain is visible. Also, rain can carry most of the radioactivity into sewers, where the radiation is well shielded from the pavement. American studies were done both top examine the visibility and mass deposits of dry and wet fallout at various types of nuclear explosion in 1956:
‘Sampling stations were located … aboard anchored barges, type YFNB, and manned ships … Particles collected in the incremental type of collector were used for these fallout studies. Since this device sequentially exposed trays … particles could be classified by time of arrival. One of the ship sampling stations was connected by an elevator device to a radiation-shielded laboratory, permitting almost immediate examination of fallout samples.’ – N.H. Farlow and W.R. Schell, U.S. Naval Radiological Defense Laboratory, technical report USNRDL-TR-170, 1957, p. 1.
For photos and analysis of fallout from the Inca shot see C. E. Adams and J. D. O'Connor, THE NATURE OF INDIVIDUAL RADIOACTIVE PARTICLES, VI. FALLOUT PARTICLES FROM A TOWER SHOT, OPERATION REDWING ( RESEARCH AND DEVELOPMENT TECHNICAL REPORT USNRDL-TR-208 ) (Because this report was originally unclassified, it does not identify the fallout event as being the 15.2 kt, 200 foot tower Inca test, but the identification of the fallout as being from that test is made in the declassified originally secret report WT-1317.)
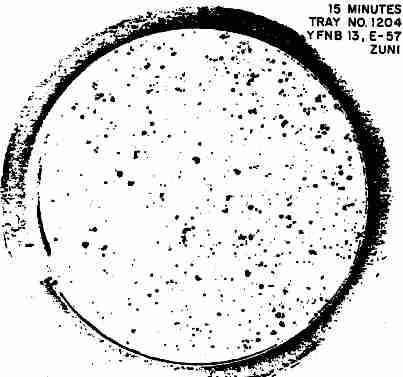 ABOVE: visible dangerous fallout; 1956 secret photo from WT-1317 of a fallout tray automatically exposed for just 15 minutes at 1 hour after detonation of the 3.53 megaton, 15% fission surface burst Zuni at Bikini in 1956. Fallout on barge YFNB 13, at 20 km North-North-West of ground zero (downwind). The tray’s inner diameter is 8.1 cm. This sample is only 22% of the total deposit of 21.9 g/m2 at that location. The barge’s radiation meter recorded a peak gamma intensity of 6 R/hr at 1.25 hours.
Generally speaking, because fallout sinks in the ocean and the barge deck was more limited in area than a flat land area, the barge radiation meters record only about 25% of those on land which are contaminated to the same extent. So on land the peak gamma ray intensity for this fallout would have been 4 x 6 = 24 R/hr at 1.25 hours. Correcting from 15% fission yield to 100% fission yield would increase this to 160 R/hr. The infinite time fallout dose is 5 times the peak intensity times the time of that intensity as measured from the time of explosion. Hence the infinite dose outdoors on land for pure fission would be 5 x 160 x 1.25 = 1000 R which is lethal. Any house would provide enough protection to save your life, however. (The dose law of 5 times intensity times arrival time is based on the t-1.2 decay law. Obviously it is well known that the fallout intensity drops below that law within 200 days, and a better law is 4 times intensity times arrival time. On the other hand, some radiation is received before the peak dose rate occurs, so it is sensible to use the factor of 5 multiplication factor as a rough approximation.)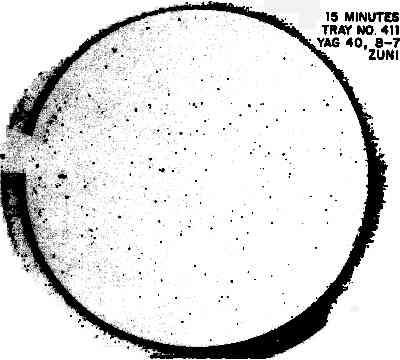 ABOVE: Seen and felt, 1956 secret photo from WT-1317 of a fallout tray automatically exposed for just 15 minutes at 6 hours after detonation of the 3.53 Mt surface burst Zuni. Fallout on ship YAG 40, at 97 km North of ground zero (downwind). The tray’s inner diameter is 8.1 cm. This sample is only 12% of the total deposit of 14.1 g/m2 at that location. The ship’s radiation meter recorded a peak gamma intensity of 7.6 R/hr at 6.7 hours.
Notice that although this tray has a lighter amount of fallout, it only contains 12% of the total deposit on the Liberty ship YAG40, whereas the previous photo is of a tray with 22% of the fallout on it. These trays were taken from 'differential fallout collectors', machines which sequentially exposed a series of trays to fallout at successive intervals, so that the particle sizes and masses, etc., deposited could be analysed as a function of time. (In early 1951 Nevada tests, trays left out to collect fallout were filled up with desert dust, blown up by the blast wave, and by the wind. Little was learned then about the mass of fallout per unit area!)
There are 45 different fission possibilities with uranium and plutonium, each creating two radioactive fission fragments, which decay in a chain of beta and gamma radiation emissions into other fission products. Hence 90 different immediate fission fragments are formed. A stable product is formed at the end of each ‘decay chain.’ There are 210 radioactive fission products, plus another 90 stable end products, a total of 300 products from fission. Some 72% of the radioactive half-lives are under 24 hours, and only 4% exceed a year.
The total radiation emission from fallout is the sum of three distinct components: the non-fractionated fission products (Zr-95, Nb-95, Mo-99, etc.), the fractionated fission products, and the neutron induced activity (Np-239, U-237, etc., which are non-fractionated).
‘Examination of the radiochemical analysis of the fall-out shows that fractionation... occurred during the formation of the particles... Most of the Kr-89 [gas] formed in fission would not have decayed [into solid rubidium-89] at the time of formation of the spherical particles… From the half-lives of their gaseous ancestors, it would be expected that there would be considerably less strontium [-89] in the fall-out particles than barium [-140]. This is actually the case.’ – Charles E. Adams, et al., Fall-Out Phenomenology, Operation Greenhouse, Annex 6.4, U.S. Naval Radiological Defense Laboratory, weapon test report WT-4, originally Secret, 1951, p. 16.
The main radiation emissions from fallout are beta particles and gamma rays, but some delayed neutrons are also emitted during the first few minutes by nuclides such as bromine-87, -88, -89, and –90. These neutrons have no effect on exposure, since the fallout is too far from the ground while they are emitted. The number of gamma rays emitted per beta particle (decay event) depends on the specific nuclide, e.g., it is only 0.000009 for Sr-89, but it is 0.891 for Cs/Ba-137. Radioactive fission fragments and their decay products consist of 36 different chemical elements, with nuclides ranging from zinc-72 up to terbium-161. Some of these are gases, but then decay into solid elements.
The decay chain precursors for the fractionated fission products like Cs-137 and I-131 eventually deposit at late times on the external surface of already-solidified fallout particles. For comparison, non-fractionated or ‘refractory’ decay chain nuclides like Zr-95, Mo-99, Np-239 and U-237, immediately condense and diffuse throughout the internal volume of hot, still-molten globules. The fireball warmth keeps gaseous and volatile elements vaporized until they decay into solids which condense on molten or solidified particles. The large, fast-falling fallout particles deposited near a nuclear detonation therefore contain reduced quantities of nuclides like strontium-89, -90, cesium-137, and iodine-131. This ‘depletion’ in local fallout is balanced by enrichment upon the small, slow-falling particles which remain in the fireball longer. This is ‘fractionation’:
‘As expected … strontium exhibits very definite fractionation... at Operation Castle after the Bravo shot... For a fall-out sample collected on land at approximately 80 miles [130 km] from the burst point, the R [reduction] value for strontium-89 was 0.14. The R value for strontium-90 using the same fall-out sample was 0.29… Fractionation … means that the quantity remaining in the atmosphere should be greatly increased over the calculated [non-fractionated] value ... The findings of the gum paper experiment of the New York Operations Office, AEC [U.S. Atomic Energy Commission], indicate that this is true and that the [strontium-90] discrepancy factor is about 3.’
– Roy D. Maxwell, et al., Evaluation of Radioactive Fall-Out, U.S. Armed Forces Special Weapons Project, September 1955, originally Secret, report AFSWP-978, p. 33.
Because of the time-dependent motion of fallout through and around the cooling fireball, fractionation is independent of explosion yield, shown by the comparison of data from 1956 megaton-yield tests with 1962 kiloton-yield tests. Fractionation is more important than fissile material.
The effect of close-in fractionation is to reduce the contributions from nearly all of the nuclides present from 1 hour to 14 days after burst. From 14 to 200 days, the effect of fractionation is gradually eliminated because non-fractionated nuclides (Nb-95, Zr-95, Ru-103, Rh-106, etc.) then predominate. Between 200 days and 10 years, the contribution of fractionated Cs/Ba-137 increases from under 1% to over 90%, so fractionation again becomes important in determining the gamma emission rate at very long times after detonation.
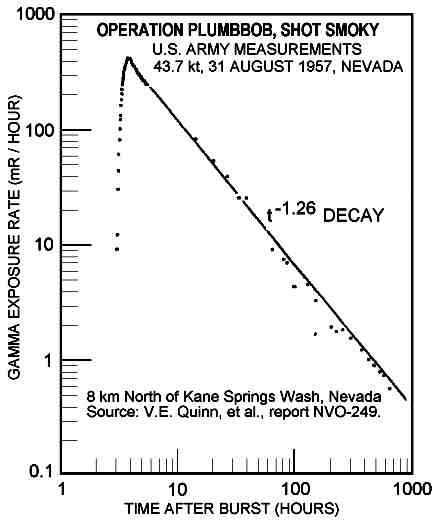
The average decay rate of severely fractionated close-in land burst fallout, including non-fractionated Np-239 and U-237 induced activity, is proportional to t-1.2 up to 208 days after detonation, t-2.50 from 208 days to 10 years, and then e-0.023t(years) after 10 years (Cs/Ba-137). It often decays somewhat faster. Many measurements substantiate the rapid decay. One example:
 For rapid decay curves from measurements taken on land across contaminated Rongelap Atoll in the days, months and years after for the heavy Bravo fallout of 1954 see online report UWFL-91, for a large number of plotted rapid decay measurements on the 1954 Castle tests thermonuclear weapon fallout see the online report USNRDL-TR-147, for extensive clean weapon (Zuni and Navajo) rapid fallout decay curves (despite some neutron induced activity) see WT-1317 online, also note that report includes data for the dirty (87% fission) Tewa and the so-called salted Flathead test fallout decay rates; for the case of the 1954 Bravo fallout mishap which contaminated many people see Dr Carl F. Miller, speech to the U.S. National Council on Radiological Protection (NCRP) symposium on 27-29 April 1981 in Virginia, published in The Control of Exposure of the Public to Ionising Radiation in the Event of Accident or Attack, pp. 99-100.
‘The increased efficiency with which superweapons disperse radioactive materials is to some extent counter-acted by the delay in arrival of fallout from the high source cloud and the rapid rate of decay which occurs in the interim.’ – R.L. Stetson, et al., Operation Castle, Project 2.5a, Distribution and Intensity of Fallout, U.S. Naval Radiological Defense Laboratory, report WT-915, originally Secret, 1956, p. 101.
For Castle coral and water burst test fallout particle chemical and radiological analysis see WT-917.
‘A number of factors make large-scale decontamination useful in urban areas. Much of the area between buildings is paved and, thus, readily cleaned using motorized flushers and sweepers, which are usually available. If, in addition, the roofs are decontaminated by high-pressure hosing, it may be possible to make entire buildings habitable fairly soon, even if the fallout has been very heavy.’ – Dr Frederick P. Cowan and Charles B. Meinhold, Decontamination, Chapter 10 (pp. 225-240) of Dr Eugene P. Wigner, editor, Survival and the Bomb, Indiana University Press, Bloomington, 1969.
As Fredrick Cowan and Charles Meinhold argued in 1969 (above), decontamination is practical in areas of very heavy fallout. In fact, it is most effective where the fallout particles are largest, so it is actually easiest as well as most effective where dangerous fallout is deposited.
A range of tested techniques is available to decontaminate different surfaces. Roads, paved areas, building surfaces, vehicles, aircraft and ships can be decontaminated by water hosing to wash contamination harmlessly down the drain. Fallout is deep-ploughed to a depth below the root length of the crops, or the long-term agricultural uptake of strontium-90 and cesium-137 is diluted by adding chemically-similar calcium and potassium compounds, respectively, to contaminated soil.
Research has been conducted to determine how soon to begin decontamination, to trade-off the benefits of decontamination against the outdoor exposures involved during the work. There are three basic stages during radiological recovery from a nuclear war: (1) evacuation of old people with inadequate radiation shielding from heavy fallout areas if they are unable to improve their shielding sufficiently with sandbags, (2) sheltering in heavy fallout areas for a few days in the part of the house furthest from the roof and outside walls, with as much mass shielding as possible, while the danger falls sharply, and (3) outdoor decontamination.
It is also possible to essentially avert the entire fallout problem by using the washdown system during fallout deposition. It is more effective to fix up a cheap water hose spray to clean the roof, walls, and surrounding urban paved areas while fallout is landing, than to spend money on sheltering, which will not remove a single fallout particle. Focus on expensive sheltering and measuring of radiation was a mistake made by Herman Kahn of the RAND Corporation in 1958, and has unfortunately overshadowed the more valuable discovery that if you do not waste time, you can just wash the fallout down the drain. Kahn thought just in terms of an invisible radiation problem, not in terms of a sand particle problem. The continuous washdown system was tested on manned ships during the 1950s nuclear tests, having been developed after a study of the 1946 Bikini fallout problems. (If you leave the fallout for weeks, decontamination becomes more difficult, because particles end up firmly lodged in crevices; and you also miss the enormous benefit of reducing the intense early time hazard.)
Between 70-75% of the non-fractionated nuclides were deposited within just 20 minutes of the 0.5 kt surface burst Johnnie Boy at Nevada on 11 July 1962. (I.J. Russell, U.S. weapon test report WT-2291, 1965.) For a study of the mechanism of fractionation effects for fallout predictions in another Nevada nuclear surface burst (Small Boy), see Charles R. Martin's online report AD-A159226. Martin plots how fractionation varies of Sr-89, for example, varies with sample size assuming that Zr-95 is a good non-fractionated reference nuclide (which is true). He also plots specific activity versus particle size. Because of fractionation, there is a mild variation in the overall specific activity of fallout with particle size.
For comparison, the report by Robert C. Tompkins and Philip W. Krey, Radiochemical Analysis of Fallout, Operation Castle, Project 2.6b, U.S. Army Chemical Center, weapon test report WT-918 (1956) on page 40 also has a plotted graph of 12 data points from the 14.8 Mt Castle-Bravo surface burst showing clearly how the specific activity of Sr-89 varies with particle size due to fractionation. The specific activity can approximately be given by the simple sum,
0.004 + 0.3/d
beta microcuries of Sr-89 per milligram of fallout debris, where d is the fallout particle diameter in microns (micrometres).
Here the first term (a constant) represents the radioactivity which is diffused throughout the fallout particle volume (and which is therefore independent of particle size) and the second term represents surface contamination on fallout particles, the specific activity being proportional to particle surface area (proportional to the square of the diameter) divided by particle volume (proportional to the cube of the diameter), i.e., the specific activity for surface contamination is proportional to (d^2)/(d^3) = 1/d where d is particle diameter. For very small particles, the majority of the radioactivity is on their surfaces, so their radioactivity is relatively soluble in water. But for large particles, the overall activity is less and it is diffused throughout the interior of the particle, leading to relatively low solubility of the radioactivity in water.
Exaggerated fallout patterns in the new manual?
Page 1-22 of National Planning Scenarios states 'AIRRAD is used to predict fallout from nuclear devices.' AIRRAD (downloadable DOS version here) reproduces grossly exaggerated nuclear test fallout patterns. So it is probably an over-estimate. I'll justify this in detail now.
The source of careless error causing an exaggeration is the nuclear test data compilation:
Manfred Morgenthau, et al., Local Fallout from Nuclear Test Detonations, Volume II: Compilation of Fallout Patterns and Related Test Data, U.S. Army Nuclear Defense Laboratory, report DASA-1251-2, 1963, Secret – Restricted Data. An unclassified extract from this was released in 1979 as DASA-1251-2-EX. I have already mentioned DASA-1251 fallout pattern selection problems in a previous post. This is not an attack at Morgenthau in general, although something was seriously wrong with the analysis of the maps of Bikini and Eniwetok on which fallout patterns were plotted. Morgenthau's compendium of Nevada and other continental fallout patterns is also available on line and is far more accurate than the Pacific test data (beware if you have a slow internet connection, it is 620 pages and 21.1 MB PDF file): DASA-1251-1-EX. The British and French test fallout patterns supplement to DASA-1251, Local Fallout From Nuclear Test Detonations, Volume 2, Compilation of Fallout patterns and Related Test Data, Supplement: Foreign Nuclear Tests, is also now online. (It contains British fallout patterns for some tests including the 25 kt Hurricane ship burst 2.7 m below the waterline at Monte Bello and the 1.5 kt Buffalo-2 surface burst at Maralinga, and a French surface burst on 1 April 1960. British test report fallout patterns are also available in better quality copies in the full AWRE reports at the UK National Archives. The French data is little use because the French didn't release the wind patterns and explosive yields to accompany the fallout patterns.)
But the chief problems with DASA-1251 results from the use of data for operations Castle and Redwing, which contain most of the measured surface burst fallout data (other test series were mainly air bursts or tower shots).
For Castle, Morgenthau carelessly reprints fallout patterns from Stetson’s 1956 report WT-915, including Stetson’s inaccurate scale on lagoon area maps. Stetson’s scale gives the distance from Enyu to Namu Islands to be 54 km, whereas it is actually 32 km, an exaggeration factor of 1.69 for the upwind fallout maps on Bikini Atoll for Castle shots Bravo, Koon, and Union. Since area depends on the square of distance, this means that the fallout areas are exaggerated by the factor 2.86. Morgenthau, et al., corrected the scale on the Bravo map of Bikini Atoll, but made the situation worse for the Koon and Union maps, where the distance from Enyu to Namu becomes 59 km and 56 km, and the distance exaggeration factors are 1.84 and 1.74, for Koon and Union, respectively. These imply fallout area exaggeration factors of 3.39 and 3.03, respectively.
This is a major exaggeration of upwind fallout data. It has particularly dramatic effects since the exaggerated Koon fallout map was used in 1997 to validate a computerised fallout prediction system called Airrad, with the report’s author stating that: ‘most of the Koon pattern area was covered by an array of fallout collection stations, so this pattern is probably reasonably accurate.’ - Mathias J. Sagartz, Testing of the AIRRAD Fallout Prediction Code, Sandia National Laboratories, Albuquerque, New Mexico, report SAND97-2613, 1997, p. 19.
This comment is totally bogus. If you compare two versions of the Koon fallout pattern, say the WT-915 version with the completely different WT-934 version which shows a 'hotspot' downwind in the Koon fallout within Bikini Lagoon (even neglecting distance scale issues), it is clear that the contours are more imagination than a reflection of the data points, which are extremely sparse. There is not a single upwind fallout measurement for the Koon fallout pattern contours exists, yet they are plotted as a series of imaginary solid lines (not dashed lines to indicate extrapolation).
The Airrad prediction beautifully matched the false Koon fallout contours, with a mean error of only 20% for downwind distances and only 26% for contour areas!
In fact, the true Koon fallout contours are a factor of 1.84 smaller in distance, 3.40 times smaller in area, so the Airrad prediction exaggerated the Koon fallout downwind distances by an average of 67%, and exaggerated the contour areas by an average of 222%. Airrad gave better results for some Nevada nuclear tests, however.
A careful check on other fallout maps in DASA-1251 shows that the distance scale of Eniwetok Atoll for the Mike shot is exaggerated by 5%. More important, the selection of fallout contour maps to represent tests of Operation Redwing, particularly Zuni, Flathead, Navajo, and Tewa, and the accompanying comments on unreliability, is unhelpful. The Redwing fallout was researched jointly by the Scripps Institute of Oceanography, the Naval Radiological Defense Laboratory, the Evans Signal Laboratory, the New York Operations Office of the Atomic Energy Commission, the Chemical Warfare Laboratories of the Army Chemical Centre, and the Air Force Special Weapons Center.
However, DASA-1251 ignores the composite fallout maps for each shot, and instead gives just the close-in data from the army Atoll survey and the partial Scripps ocean survey reprinted directly from weapon test report WT-1316, 1961. The problem with this approach is that large areas between the ocean survey and the Atoll survey are uncovered, so that no closed fallout contours for any of the tests is given, and no reconciliation between land and ocean readings are made. DASA-1251 also comments, falsely, that the amount of fallout which sank below the ocean thermocline after shots Tewa and Zuni is simply unknown.
In fact, Dr Triffet, in weapon test report WT-1317, p. 128, directly compares the total deposit of fallout on collection platforms aboard ships with the amount inferred by taking water samples and radioactivity readings at varying depths underwater. In addition, the rate of particle sinking in the water was measured by underwatre probes. The large fallout particles of calcium oxide disintegrated in the ocean (just as they did when landing on on moist skin), and even while 80% probably remained insoluble, it was then mixed with the water as tiny particles with an insignificant sinking rate. Consequently, the complete, reconciled fallout maps for Redwing tests given by Triffet in WT-1317, 1961 will be used in this book, in preference to the partial and misleading data given in DASA-1251.
On the subject of falsified fallout map distance scales, it is interesting that the June 1957 U.S. Congressional Hearings of the Special Subcommittee on Radiation of the Joint Committee on Atomic Energy, The Nature of Radioactive Fallout and Its Effects on Man reprints a submitted U.S. Naval Radiological Defense Laboratory report (Edward A. Schuert's U.S. Naval Radiological Defense Lab. 1957 report USNRDL TR-139, A Fallout Forecasting Technique with Results Obtained at the Eniwetok Proving Grounds) with a falsified distance scale for some fallout maps including the Redwing-Tewa test. All distances shows on that Tewa fallout pattern are half the correct scale, so the areas are underestimated by a factor of 4. However, Triffet's report on pages 60-98 of the June 1959 U.S. Congressional Hearings (held before the same subcommittee), The Biological and Environmental Effects of Nuclear War, contains a reprint of the Tewa fallout pattern with the correct distance scale. (The British Home Office, in it's 1959 and 1974 civil defence publication Nuclear Weapons, reprinted the version of the Tewa fallout pattern with the false distance scale from the 1957 U.S. Congressional Hearings, which has fallout areas only a quarter of the actual size.) Triffet's major report discloses:
‘The general objective was to obtain data sufficient to characterize the fallout, interpret the aerial and oceanographic survey results, and to check fallout model theory for Shots Cherokee, Zuni, Flathead, Navajo, and Tewa… This report summarizes the times and rates of arrival, times of peak and cessation, mass-arrival rates, particle-size variation with time, ocean-penetration rates, solid- and slurry-particle characteristics, activity and fraction of device deposited per unit area, surface densities of chemical components, radionuclide compositions with corrections for fractionation and induced activities, and photon and air-ionisation decay rates.’
– Dr Terry Triffet and Philip D. LaRiviere, Operation Redwing, Project 2.63, Characterization of Fallout, U.S. Naval Radiological Defense Laboratory, San Francisco, California, report WT-1317, originally Secret, 1961, p. 5.
Blast exaggeration in the new manual?
Blast reduction due to ground-level diverging blast energy being irreversibly lost in the act of doing damage to buildings. This was pointed out by Dr William Penney in 1970, but is ignored in American studies. It is quite easy to calculate. Simplistically, the energy needed to knock a building down is the force (i.e. the net peak reflected pressure multiplied by the exposed cross-sectional area) multiplied by the distance the building is moved. The distance a building or wall is moved is known from the amount of destruction produced. This calculation is valid if the damage depends on peak overpressure (diffraction type damage). For rigid diffraction-sensitive buildings, the pressure on the front wall is typically ten times that on the back wall, so the latter can be ignored. (However, for drag sensitive targets the time factor is important.)
Civil defence can deter terrorist attacks by making the effort that goes into them meaningless. If people know the effects and how to mitigate them easily, instead of panic and nonsense, terrorists will be more likely to stay away. In that sense, despite various possible issues with the new civil defence handbook, it is valuable. People often say that civil defence against terror weapons like gas was useless in World War II because the weapons were not used. Actually, the Nazis did not use gas because Britain had taken precautions against it, training everyone, issuing cheap light weight gas masks to everyone, and advertising the fact it was prepared. They would have been more likely to use such weapons if Britain had not been prepared, so civil defence was useful not only in the Blitz but in negating many threats:
Exaggerating nuclear effects will encourage nuclear terrorism and make the threats worse, see previous posts here and here. Similarly for other kinds of threats. The whole 'mass destruction' exaggeration and hype industry needs to be taken out:
‘During World War II many large cities in England, Germany, and Japan were subjected to terrific attacks by high-explosive and incendiary bombs. Yet, when proper steps had been taken for the protection of the civilian population and for the restoration of services after the bombing, there was little, if any, evidence of panic. It is the purpose of this book to state the facts concerning the atomic bomb, and to make an objective, scientific analysis of these facts. It is hoped that as a result, although it may not be feasible completely to allay fear, it will at least be possible to avoid panic.’
 ABOVE: the limited reality of fallout gamma doses and dose rates outdoors on an ideal smooth infinite surface, 2 Mt land surface burst with 1 Mt fission yield and a 24 km/hour wind speed. Curves are from Glasstone and Dolan, 1977 which is based on DELFIC, DEfence Land Fallout Interpretative Code; for a discussion of DEFLIC's cloud rise model see Daniel E. Zalewski's report AFIT/GNE/ENP/01M-06, Vincent J. Jodoin's ADA265587, and Karson A. Sandman's report AFIT/GNE/ENP/05-11, and for an analysis of the particle size distribution details, their effect on fallout pattern predictions, and how DELFIC calculates rainout and other weather phenomena effects on fallout, see Eric T. Skaar's report AFIT/GNE/ENP/05-13. For a detailed comparison of DELFIC predictions against measured fallout at six Nevada tests, including subsurface bursts and low air bursts (George, Ess, Zucchini, Priscilla, Smoky and Johnie Boy) see Richard W. Chancellor's report AFIT/GNE/ENP/05-02. You can escape lethal doses the fallout by walking crosswind. For a history of fallout prediction see Jay C. Willis' report ADA079560. You don't need a radiation meter because fallout is visible as shown above. We have already discussed here and here how America exaggerated the gamma ray energy from fallout during the Cold War, despite British opposition. Fallout is a seriously exaggerated threat. With public knowledge, it can be mitigated.
Even normal houses provide a large protection factor which would dramatically cut down the effects, assuming people don't run away from the fallout to simply avoid it (obviously, wearing rain gear to prevent skin contamination and associated beta burns). The doses above would be reduced by 30% on a desert due to terrain roughness, and by 50% in a city due to buildings absorbing long range gamma rays. Inside houses, the doses and dose rates would be additionally reduced by factors ranging from 2 (for small wooden sheds) to 20 for typical brick buildings and 200 or more for apartments or offices in tall blocks (well away from the ground and from the roof).